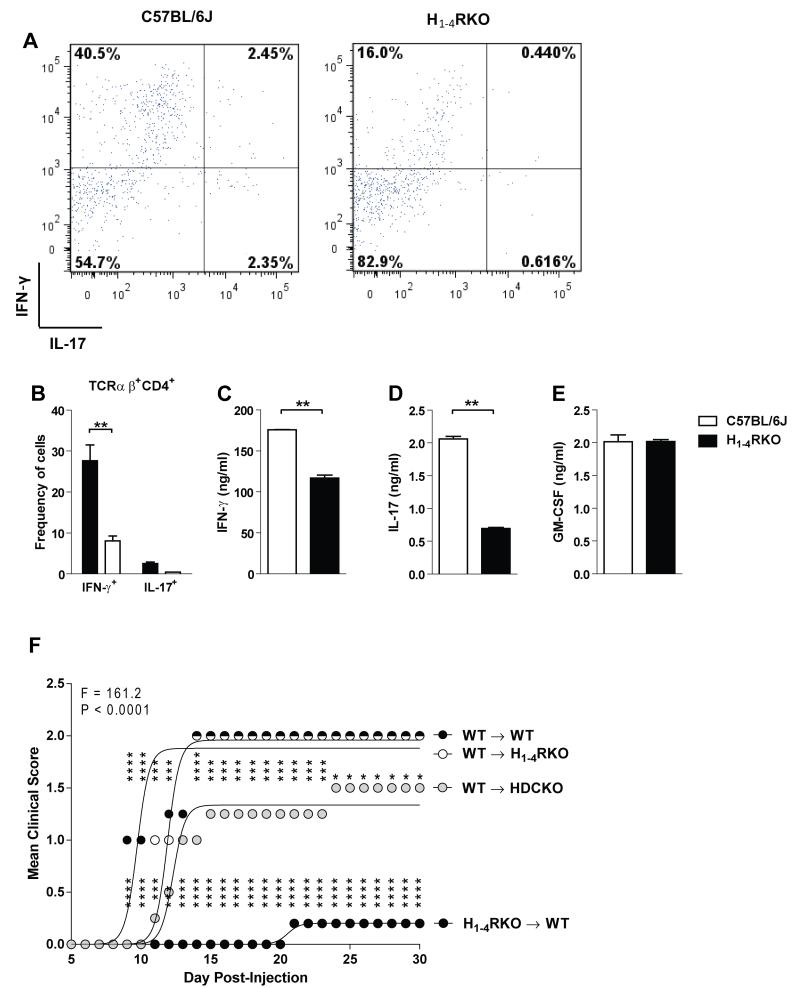
Figure 5. T cells from H1-4RKO mice are less encephalitogenic.
WT and H1-4RKO mice were immunized using 1× immunization protocol, d12 post-immunization DLN cells were restimulated with MOG35-55 and IL-12 for 72 h. (A) Flow cytometric analysis of WT and H1-4RKO cells stimulated with PMA/ionomycin + Brefeldin A for 4 h and stained intracellularly for IFN-γ and IL-17, gated on CD4 and TCRβ. (B) The percentage of IFN-γ+ and IL-17+CD4+ cells from the DLN of WT and H1-4RKO mice and shown as mean ± SEM of n = 5 per strain. In (B) significance of differences observed in the percentage of cytokine positive cells were determined by two way ANOVA followed by Bonferroni’s post hoc multiple comparison test (**, p<0.01). Cell Culture supernatants were screened for (C) IFN-γ, (D) IL-17, and (E) GM-CSF by ELISA and shown as mean ± SEM of n = 5 per strain. In (C, D, and E) significance of differences in cytokine production was determined using the Mann Whitney test (**, p<0.01). Equal numbers (10 × 106 cells/animal) of restimulated cells were transferred into WT (n = 5/strain) recipients. (F) The clinical scores following immunization were recorded and the significance of differences between clinical courses was calculated by regression analysis with the best fit curve shown and two-way ANOVA followed by Bonferroni post-hoc multiple comparison test (*, p<0.05; ***, p<0.001; ****, p<0.0001).

