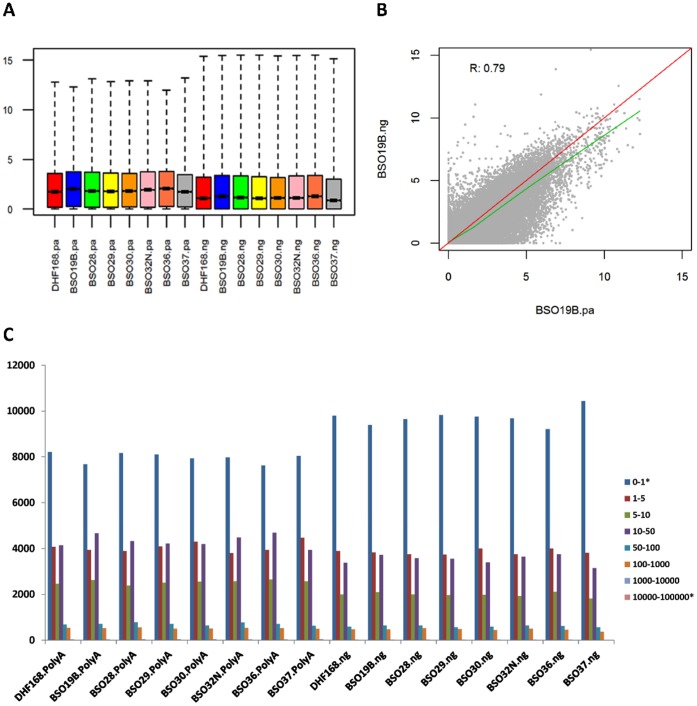
Figure 2. Gene expression distribution, correlation, and detected genes.
A: Boxplot of RPKM normalized expression for 8 samples from the PolyA and 8 samples from the NuGEN library preparation (from left to right in the same order). Samples with the same color were the same RNA extract but prepared by either the PolyA or NuGEN protocol. B: The example scatter plot of RPKM expression of the same sample (sample BSO19B) between two library preparations. R - Pearson correlation coefficient. Red line – diagonal line for perfect correlation. Green line – fitted lowess cure for the data. C: Gene counts in different expression level binned by standardized expression RPKM. There were 20,156 genes detected in at least one sample and all these genes were used for the binning. Y-axis: number of genes detected in each expression range in RPKM. Samples on the left side are the PolyA and on the right are the NuGEN. NuGEN samples had more genes missed (in 0–1 range) than PolyA samples. Two genes are highly expressed (>10,000 rpkm) in the NuGEN samples but no genes were in this range in the PolyA samples. The ranges with * had more genes in the NuGEN samples than the PolyA samples.

