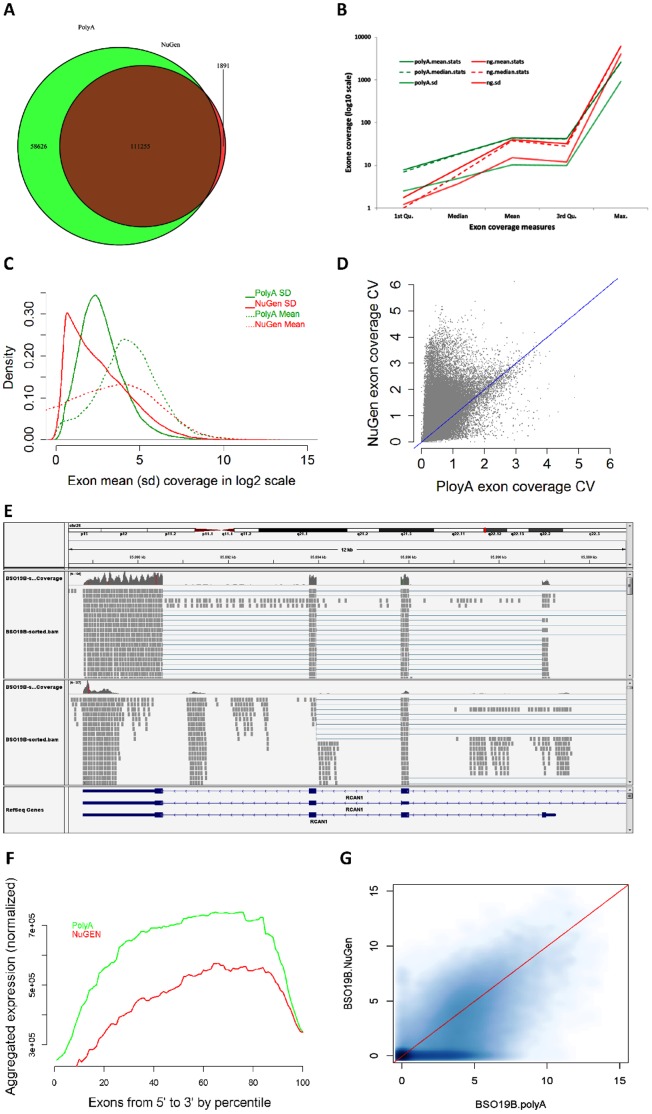
Figure 5. Exon and exon base coverage between the PolyA and the NuGEN preparations.
A: Captured exons by either the PolyA or the NuGEN with the common and unique ones shown in the Venn diagram. B: For commonly captured exons (111,255), the PolyA have higher and more even coverage than the NuGEN sample. C: Compared to the PolyA library, the average exon coverage for the NuGEN is more spread, with many exons at very low coverage (higher density on the left) while a few with very high coverage (long tail on the right side). Although the low variance at the low covered exons, the variance for highly covered exons are larger than the PolyA library. D: The coefficient of variance in majority of exons is higher in the NuGEN preparation than the PolyA preparation. Blue line – diagonal line. E: An example exon coverage for gene RCAN1. The upper panel is from the PolyA library preparation and the lower is from the NuGEN preparation. Uneven coverage is more obvious in the NuGEN than in the PolyA. A exon skip in the NuGEN sample is also seen. Noted also is there are quite a few reads mapped into the intronic regions in the NuGEN sample. F: 3′ bias at transcript level, both in the PolyA and the NuGEN preparation. The NuGEN appears more obvious. The data is normalized by RPKM at exon level and the transcript level is standardized at percentile. G: The aggregated expression (coverage) from the NuGEN is lower than the PolyA.

