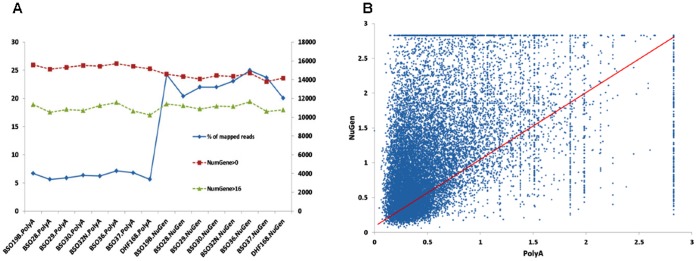
Figure 6. Intragenic expression of the PolyA and the NuGEN samples.

A: The percentage of mapped reads to intragenic regions are much higher in the NuGEN than the PolyA samples (left axis for the blue line), however the number of genes with detected intragenic expression is lower than or similar to the PolyA samples. B: intragenic expression coefficient of variance between the PolyA and the NuGEN samples. The NuGEN samples have much higher variance than the PolyA samples.
