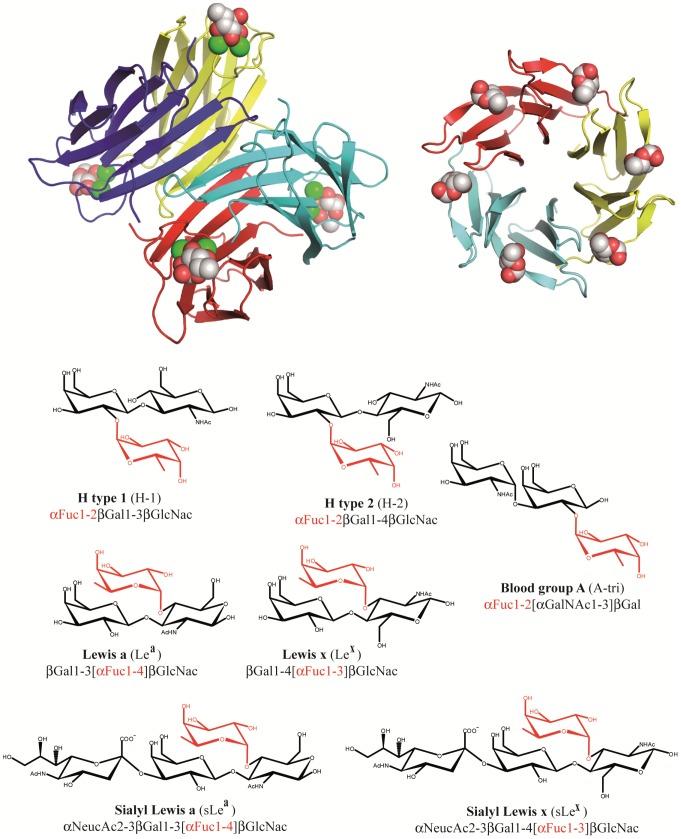
Figure 1. Representation of the bacterial lectins and oligosaccharides used in the docking calculations.
Top: Graphical representation of the two bacterial lectins. From left to right LecB/fucose and BambL/fucose complexes have been adapted from PDB 1GZT and 3ZW2 respectively. The fucose ligand and calcium atoms are displayed as spheres. Bottom: Schematic representation and sequences of fucosylated oligosaccharides.

