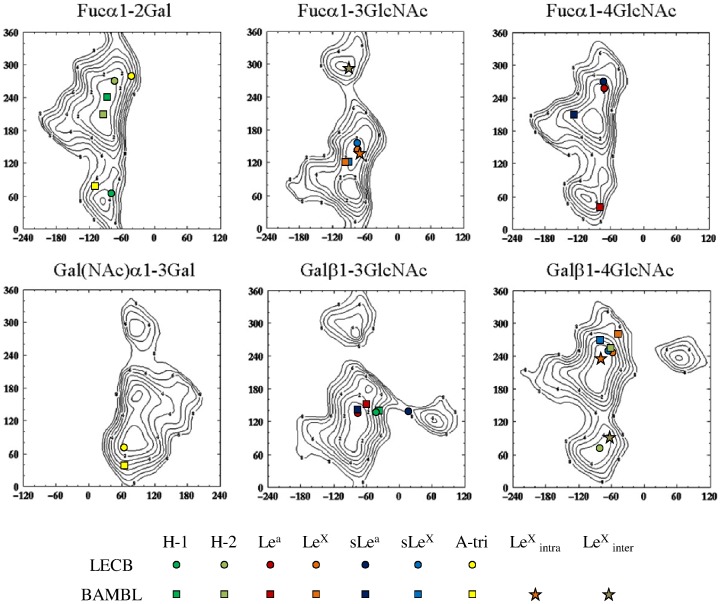
Figure 5. Energy maps and docked conformations.
Isoenergy contrours (1 kcal/mole) are represented as a function of Φ (x-axis) and Ψ (y-axis)torsion angles for all glycosidic linkages of interest taken from Glyco3D (http://glyco3d.cermav.cnrs.fr/) with superimposition of oligosaccharide conformations derived from docking (circles and squares) or protein crystallography (stars). Torsion angles are defined as Φ = θ(O5-C1-O1-Cx) and Ψ = θ(C1-O1-C′x-C′x+1).

