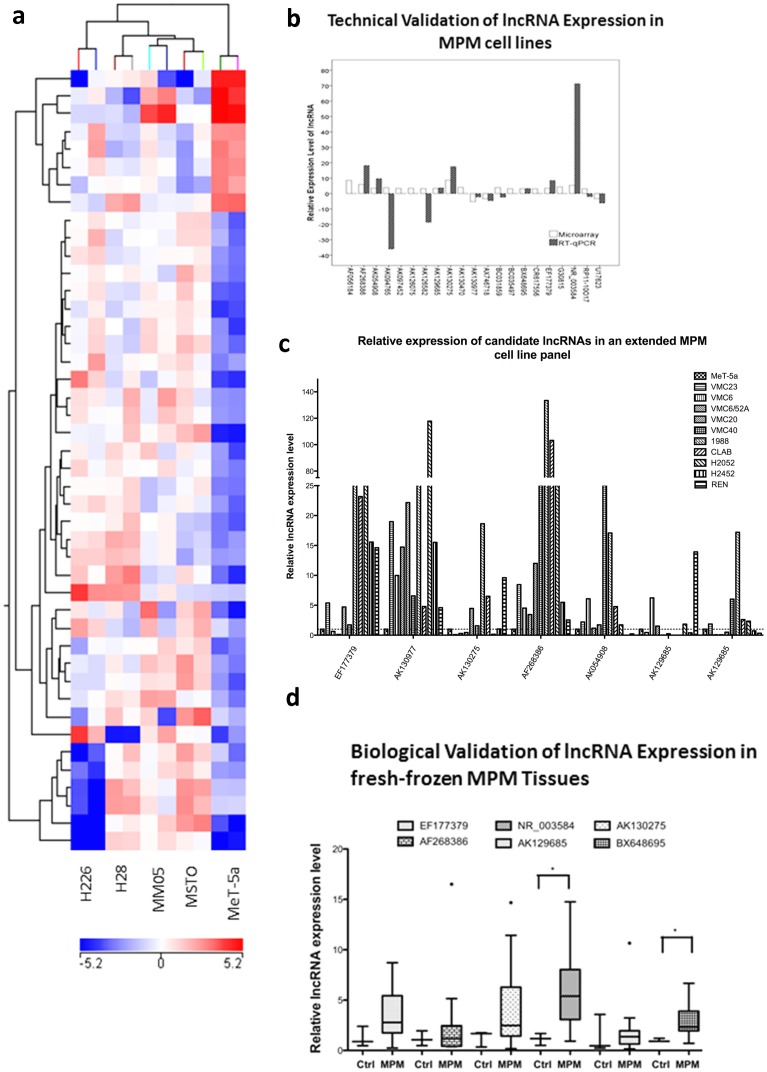
Figure 1. RT-qPCR validation reveals significant lncRNA expression differences in MPM cell lines and fresh-frozen tissue.
Levels of lncRNA expression were normalised to 18S and relative expression levels compared to the average level in the control samples for MPM tissues and MeT-5A for cell lines using the 2−ΔΔCq method. (a) Unsupervised cluster analysis of the top 44 lncRNAs found to be differentially expressed between MeT-5A and MPM (H226, H28, MSTO, MM05) cell lines using NCode Long Noncoding RNA microarrays. All cell lines were profiled in duplicate. Red = regions over-expressed, Blue = regions under-expressed. (b) Nine candidate lncRNAs were technically validated in MPM cell lines using RT-qPCR. For RT-qPCR, lncRNA expression levels were normalised to 18S and are expressed relative to MeT-5A. (c) NR_003548 and BX648695 were significantly elevated in MPM tissues compared to benign pleura. Turkey box plots have median values represented by the line within the boxes, and the 25th and 75th percentiles represented by the upper and lower lines of the box. (d) 7 candidate lncRNAs were biologically validated in an extended panel of 10MPM cell lines. All candidates demonstrated consistent up-regulation of expression. MPM – Malignant Pleural Mesothelioma, lncRNA – long noncoding RNA, Ctrl – Benign Pleura, * statistically significant at P<0.05 (two-tailed t-test).

