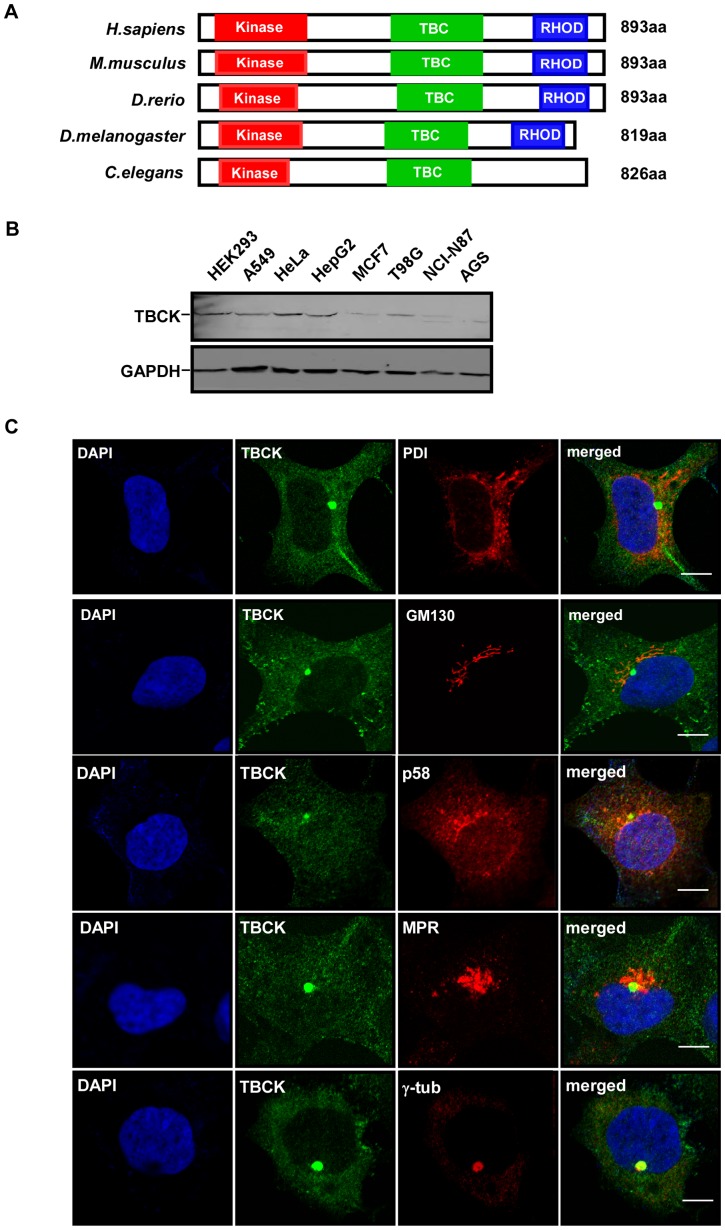
Figure 1. Characterization of TBCK.
(A) Schematic comparison of TBCK homologs in H. sapiens, M. musculus, D. rerio, D. melanogaster, and C. elegans. Red, green and blue bars indicate possible kinase domain, TBC domain and rhodanese homology domain, respectively. (B) Expression of TBCK in mammalian cell lines. Total lysates from the indicated cells were resolved by SDS-PAGE and subjected to Western analysis. (C) Subcellular localization of TBCK. HEK293 cells grown on cover slides were immunostained with the antibodies as shown. DNA was visualized by DAPI. Bar, 10 μm.

