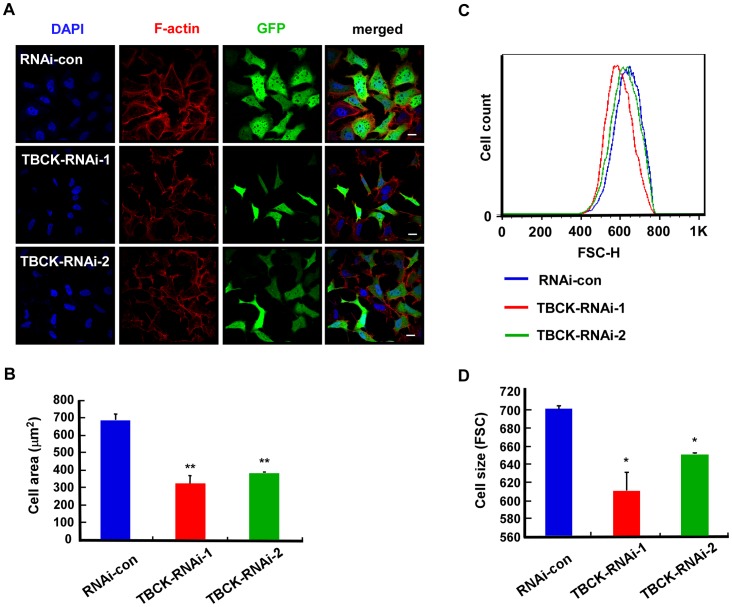
Figure 3. TBCK depletion reduces cell size.
HEK293 cells were infected with the indicated lentivirus and subjected to fluorescence microscopy (A–B) and FACS analysis (C–D). (A–B) GFP-positive signals indicate the cells infected by lentivirus. Bar, 20 µm. The area measurements of infected cells were quantified by Image-Pro Plus 6.0 software. Data are shown as the mean of three independent experiments ± SE (** P<0.01, n>200). (C–D) Representative histogram of flow cytometry shows the size distribution (FSC-H) of GFP positive cells that were stained with propidium iodide. The mean of three independent experiments ± SE is shown (* P<0.05, n>100,000).

