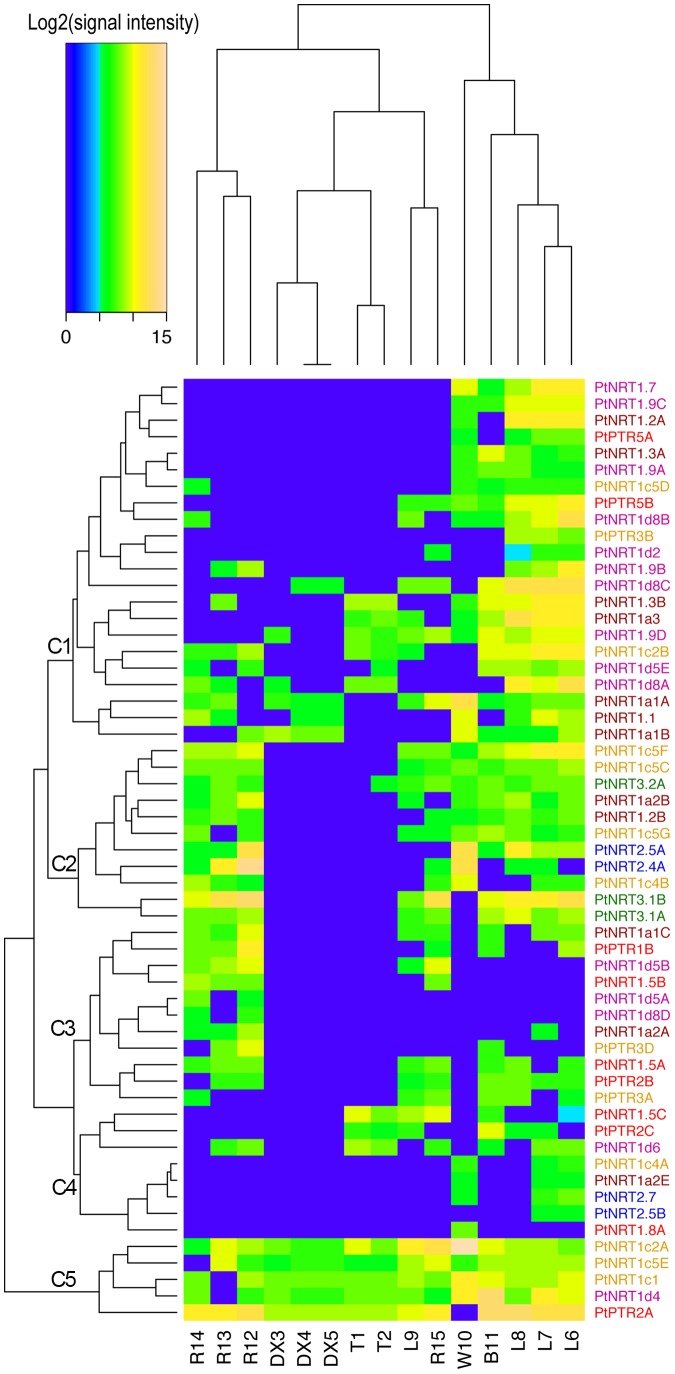
Figure 3. Expression profiles of NRT family genes in Populus across different tissues.
The heatmap represents the hierarchical clustering of average log2(signal intensity) of Populus NRT genes in various tissues. T, stem top; DX, developing xylem; L, leaves; W, wood; B, bark; R, roots. The numbers refer to different experiments compiled in Table S2. The color of the gene name represents the clade in the phylogenetic tree (Figure 1). The Affymetrix microarray data were obtained from ArrayExpression database (http://www.ebi.ac.uk/arrayexpress) and their accession number are shown in Table S2.

