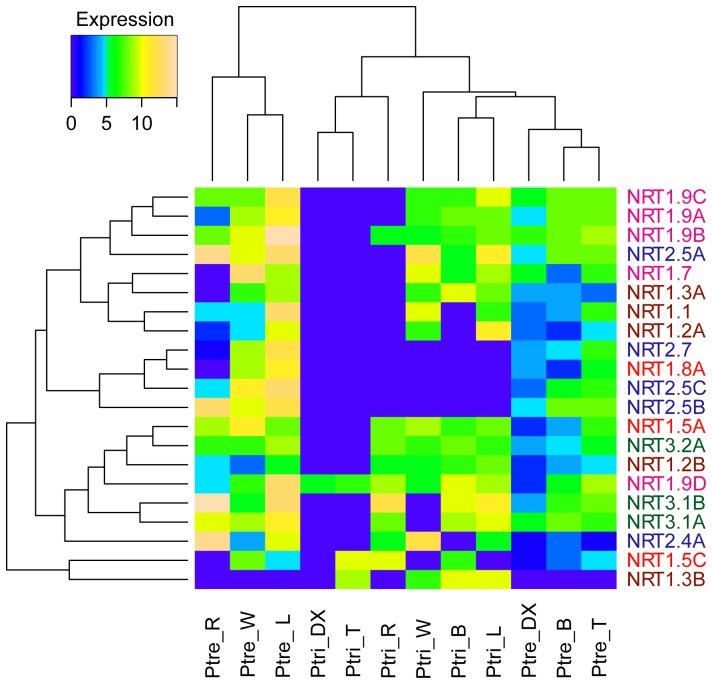
Figure 4. Comparison of tissue-specific expression patterns of NRT genes in P. trichocarpa (Ptri) and P. tremula (Ptre).
The heatmap represents the hierarchical clustering of average log2(relative expression) of NRT genes in stem top (T), bark (B), developing xylem (DX), leaves (L), wood (W), and roots (R). The color of the gene name represents the clade in the phylogenetic tree (Figure 1).

