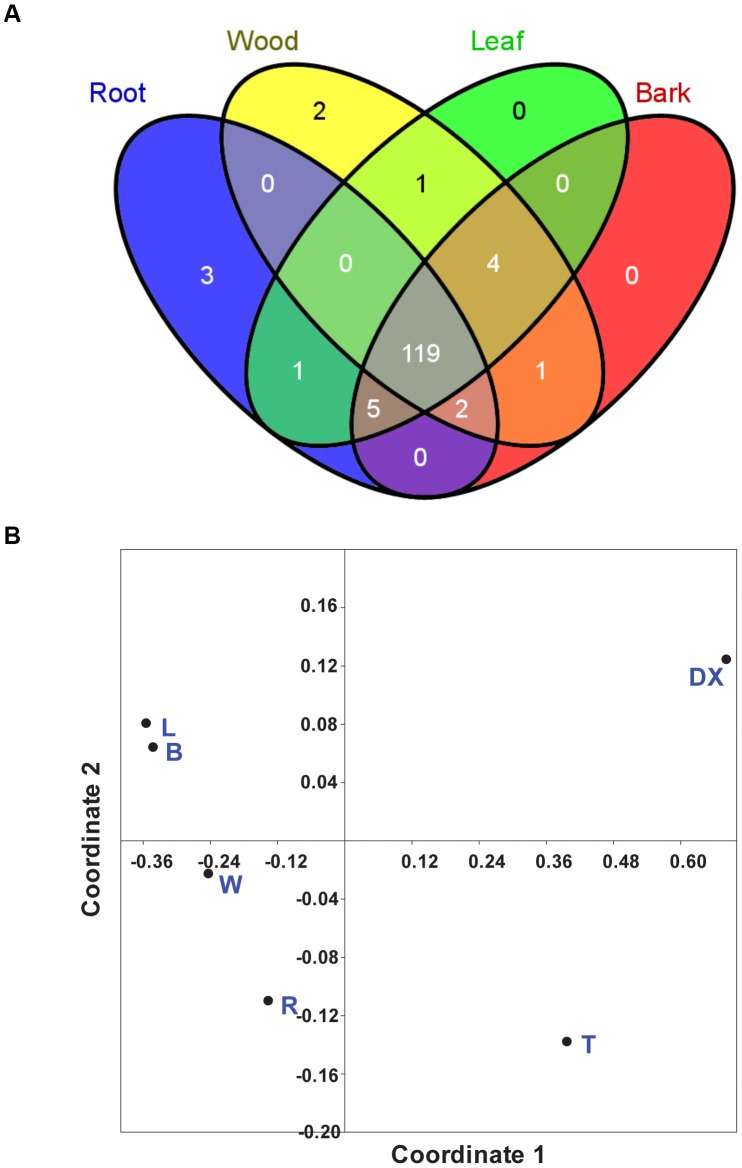
Figure 5. cis-regulatory elements of NRT genes in P. trichocarpa.
A. Overlapping CREs of NRT genes in leaves, bark, wood, and roots. The diagram shows the number of CREs in PtNRT genes expressed in specific tissues. The Venn diagram was drawn using VENNY (http://bioinfogp.cnb.csic.es/tools/venny/). B. Nonmetric multidimensional scaling (NMDS) ordination of CREs abundance and tissue specific expression of PtNRT genes. T, stem top; DX, developing xylem; L, leaves; W, wood; B, bark; R, roots. The data matrix used for the NMDS analyses is shown in Table S3.

