
Figure 3. Phase slip, lag, and drift.

(a) Phase angle difference  as a function of time for various applied torques on helix
  and the distance
  . The torque
  is changed from 200 (top) to 920 (bottom) with an increment of 40; the constant torque is
 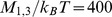 . (b) Average phase lag
  as a function of the torque
  . The red line indicates the fit
 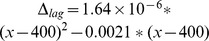 , where
  . The blue line is the tangent at
 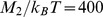 . The inset provides an approximate measure of the number of occurring slips during the time interval
  as a function of the applied moment
  .
.