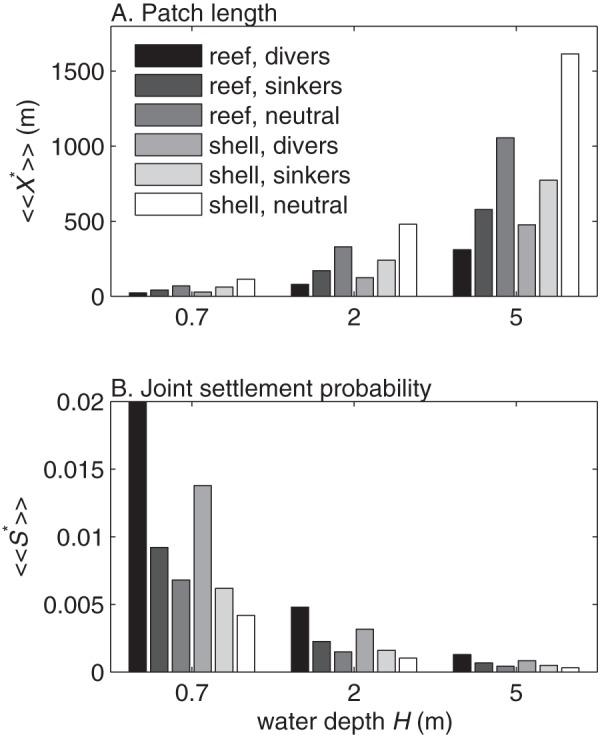
Figure 9. Mean optimal patch lengths.

Mean of tidally averaged A) optimal patch length  and B) maximum joint settlement probability
  vs. water depth
  . Means are computed from tidally averaged values with peak tidal velocities
  cm s-1. Results are shown for diving larvae, passively sinking larvae, and neutrally buoyant larvae on natural oyster reef and deposited oyster shell.
