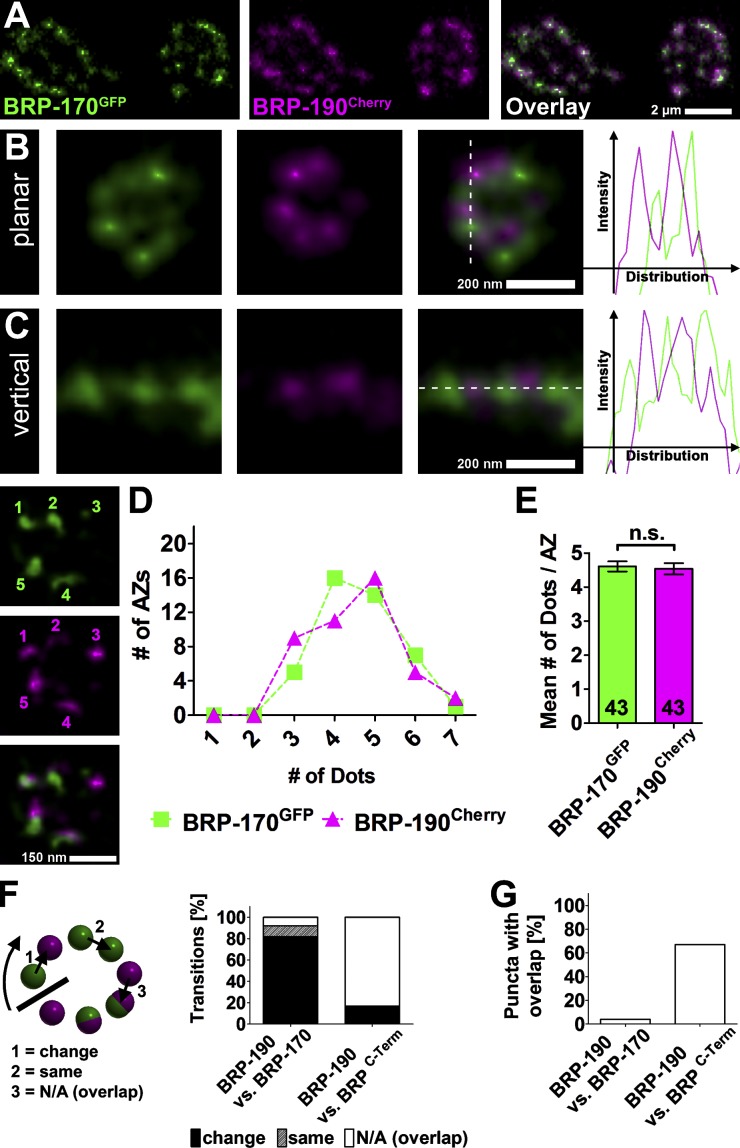
Figure 3.
Superresolution analysis of BRP isoform distribution at NMJ AZs. (A) Live imaging in intact third instar larvae expressing BRP-170GFP and BRP-190Cherry. (B and C) Images of individual AZs labeled with BRP-170GFP and BRP-190Cherry acquired with a two-color STED microscope (∼50 nm xy resolution compared with ≥200-nm resolution of a confocal microscope). Dotted lines define the position of the intensity distribution profiles (right). (D) The number of BRP-170GFP and BRP-190Cherry spots per AZs (x axis) is plotted against the number of AZs with that number of dots (y axis); counting example is shown on the left. (E) Quantification of mean number of BRP-170GFP and BRP-190Cherry dots per AZ. BRP-170GFP: 4.6 ± 0.1; BRP-190Cherry: 4.5 ± 0.2, P = 0.7663; Mann–Whitney U test; n (AZs) is indicated in the bars and is identical to D. Error bars represent SEMs. (F) Quantification of transitions determined via puncta to puncta line profiles of planar AZs. Transitions categorized into three categories as illustrated on the left. BRP-190 versus BRP-170: change, 82%; same, 10%; N/A (overlap), 8%; n (AZs) = 21; BRP-190 versus BRPC-Term: change, 17%; same, 0%; N/A (overlap), 83%; n (AZs) = 19. (G) Quantification of the fraction of overlapping punctae determined by line profiles of planar AZs. BRP-190 versus BRP-170: 4%; BRP-190 versus BRPC-Term: 67%; n is the same as in F.

