Figure 4.
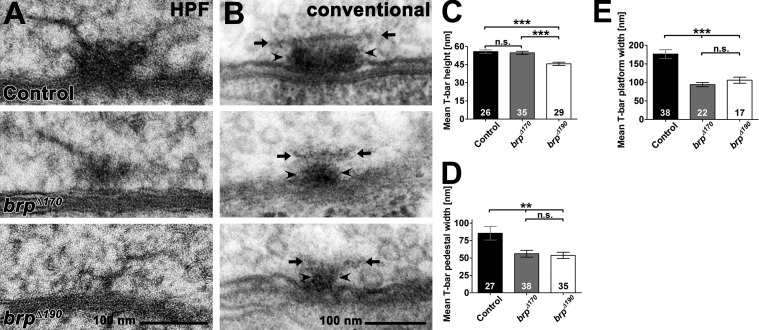
Ultrastructural analysis of brp isoform mutants. (A) Representative T bars taken from random ultrathin sections from controls, brpΔ170, and brpΔ190 mutant third instar larvae after HPF embedding. (B) Examples of electron micrographs of T bars in controls, brpΔ170, and brpΔ190 mutants third instar larvae after conventional embedding. T-bar pedestal (arrowheads) and platform (arrows) are indicated. (C) The T-bar height (pedestal plus platform) was reduced in brpΔ190 mutants compared with controls, whereas no difference could be detected in brpΔ170 mutants (control: 55.8 ± 1.4 nm; brpΔ170: 54.7 ± 1.4, P = 0.98 vs. control; brpΔ190: 45.7 ± 1.4 nm, P < 0.001 vs. control and P < 0.001 vs. brpΔ170; n is as indicated in the bars). (D) T-bar pedestals were significantly thinner in both isoform mutants compared with controls (control: 85.5 ± 9.8 nm; brpΔ170: 56.0 ± 4.9, P < 0.01 vs. control; brpΔ190: 53.7 ± 4.4 nm, P < 0.01 vs. control and P = 0.93 vs. brpΔ170; n is as indicated in the bars). (E) T-bar platforms were significantly thinner in both isoform mutants compared with controls (control: 176.5 ± 11.8 nm; brpD170: 94.0 ± 5.8 nm, P < 0.0001 vs. control; brpD190: 105.8 ± 8.2 nm, P = 0.0004 vs. control and P = 0.3573 vs. brpD170; n is as indicated in the bars). All panels show mean values and errors bars representing SEMs. **, P ≤ 0.01; ***, P ≤ 0.001; n.s., P > 0.05, Mann–Whitney U test.

