Figure 7.
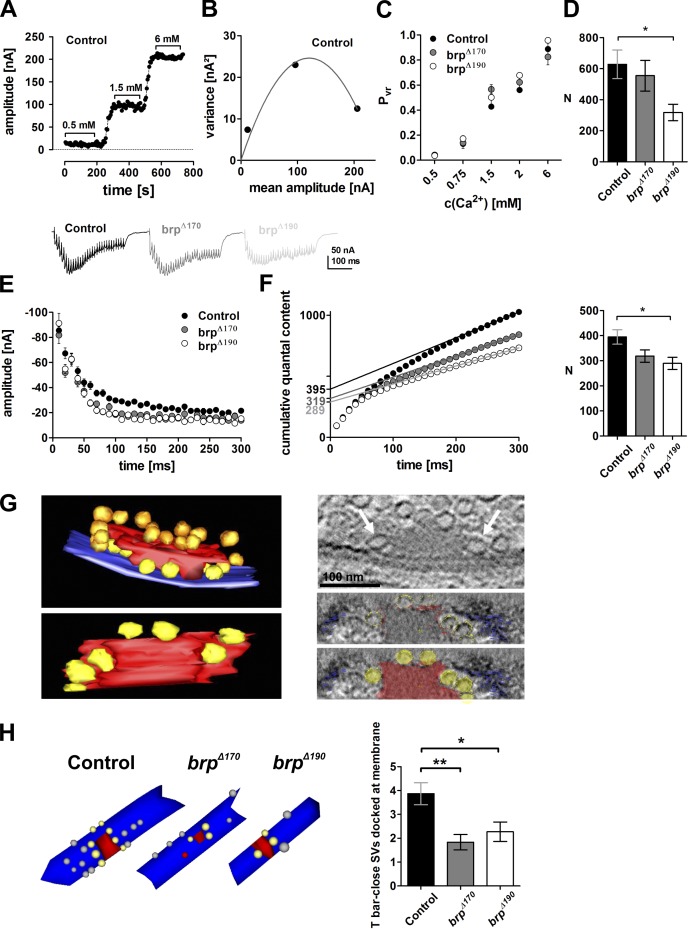
BRP isoform mutants have normal vesicular release probability but harbor fewer release-ready vesicles. (A) Control example of eEJC amplitudes recorded at the indicated Ca2+ concentrations. (B) Parabolic fit of variance–mean analysis of example cell in A. (C) Vesicular release probabilities of brpΔ170 and brpΔ190 mutants at various Ca2+ concentrations do not differ from controls (P > 0.05 for all Ca2+ concentrations; one-way ANOVA Tukey’s posttest). (D) Number of release-ready vesicles determined by variance–mean analysis. (E) Example traces (top) and quantification (bottom) of high-frequency trains for control, brpΔ170, and brpΔ190 recorded in 1.5 mM extracellular Ca2+. eEJCs decreased in both mutants and control to a steady-state level with a faster decay in the mutants. (F) Release-ready vesicle pool sizes determined by back extrapolation of cumulative quantal contents (extrapolated straight lines are indicated in the graph). (G, left) Rendered tomogram in side and bottom view of a wild-type NMJ T bar. SVs tethered distally at the T bar (red) indicated in gold, and SVs docked at the membrane (blue) proximal to the T bar indicated in yellow. (right) Virtual section showing two SVs next to the T-bar matrix (arrows). (right bottom) Bottom view of the T bar with membrane/T bar close SVs using the slicer option of 3dmod. SVs are arranged around the T-bar pedestal. (H, left) Examples of serial section EM reconstructions of AZs from controls, brpΔ170, and brpΔ190 mutants. Red, electron-dense structures; gray, docked vesicles; yellow, docked, T bar proximal SVs. (right) Quantifications of SV numbers obtained from AZ reconstructions after serial sectioning EM. T bar–proximal SVs docked at the plasma membrane were significantly reduced in both isoform mutants (control, 3.9 ± 0.5; brpΔ170, 1.8 ± 0.3, P < 0.01 vs. control; brpΔ190, 2.3 ± 0.4, P < 0.05 vs. control, Mann–Whitney U test). All panels show mean values and errors bars representing SEMs (unless otherwise noted). *, P ≤ 0.05; **, P ≤ 0.01.

