Figure 3.
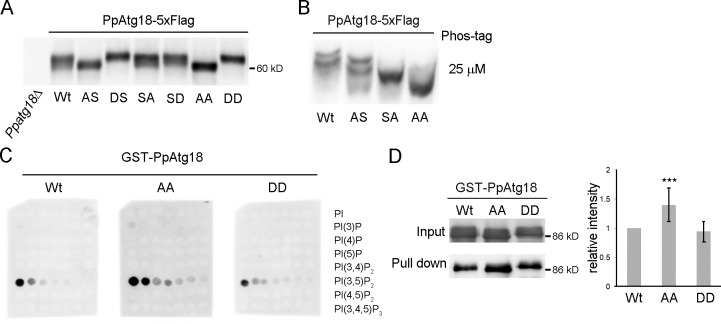
PpAtg18 is phosphorylated at two distinct sites in vivo. (A) The designated PpAtg18 phosphorylation mutants were grown in SD, collected at the exponential phase, and analyzed (5 µg) by immunoblotting. (B) Analysis of PpAtg18 variants using Phos-tag. The samples are the same as those used in Fig. 3 A. (C) PIP array analysis. Membranes were incubated with 1.0 µg/ml protein and detected simultaneously to ensure equal exposure times. (D) Liposome pull-down assay of PpAtg18 phosphorylation-defective mutants. The samples were subjected to immunoblotting and the bands were analyzed by densitometry. Error bars indicate mean ± SEM. ***, P < 0.1.

