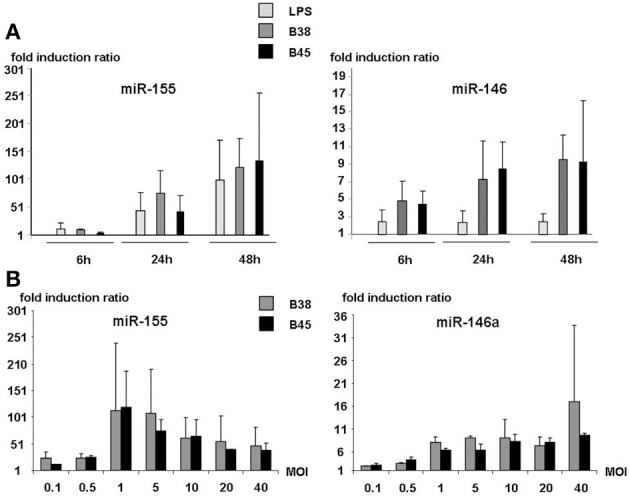
Figure 2.

MOI dependence and kinetic analyses of miR-146a and miR155 expression in activated dendritic cells. (A) DCs were either stimulated with E. coli LPS or cocultured with H. pylori strains B38 or B45 at MOI 1 for 6, 24, or 48 h. (B) DCs were cocultured with H. pylori strains B38 or B45 at MOIs ranging from 0.1 to 40 for 48 h. For both experiments, miRNA levels were determined by RT-qPCR. Data is presented as the fold induction ratio (mean + standard deviation of duplicate) of activated vs. non-activated DCs and is representative of one experiment out of 3.
