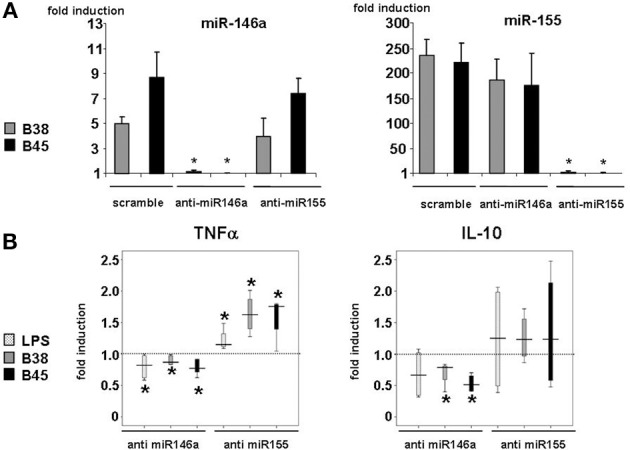
Figure 3.

Effect of miR-146a and miR-155 loss of function in H. pylori-induced miRNA levels and TNFα and IL-10 production. (A) Changes in miR-146a and mir-155 relative levels in DCs transfected with anti-miRNA oligonucleotides: DCs were transfected with 100 nM of miRNA-antisense (anti-miR-146a or anti-miR-155) or scrambled oligonucleotides before being challenged with B38 or B45 H. pylori strains at MOI 1 for 48 h. RTqPCR data are presented as the fold induction ratio (mean + standard deviation of triplicates) in activated DCs and are representative of one experiment out of 4.*if p < 0.05 compared to miRNA levels obtained on activated DCs treated with scrambled oligonucleotides. (B) TNFα and IL-10 production in activated DCs transfected by either anti-miR146a or anti-miR155 oligonucleotides: DCs were transfected as in (A) and activated with E. coli LPS (100 ng/ml) or H. pylori B38 or B45 strains at MOI 1 for 48 h. TNFα and IL-10 production was evaluated by flow cytometry. The horizontal bar across the box indicates the median and the capped bars indicate the minimum and maximum data values of fold induction ratio compared to scrambled oligonucleotide-treated cells for 4 independent experiments corresponding to 4 different donors (*if p < 0.05).
