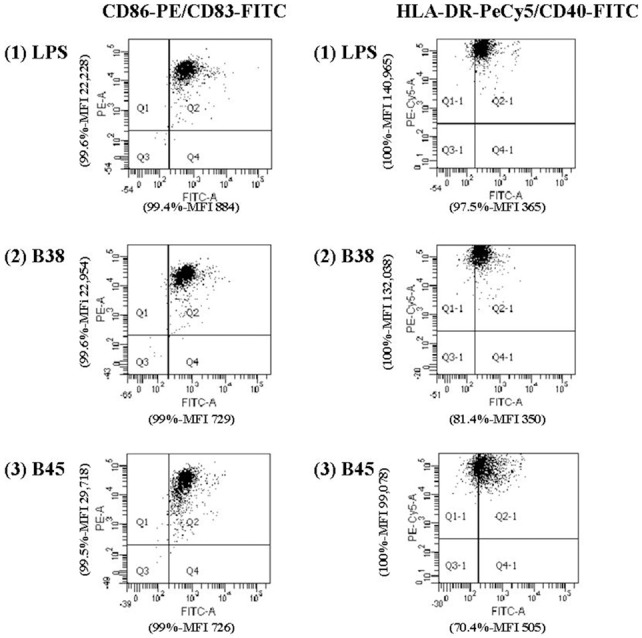
Figure A2.

Upregulation of HLA-DR, CD86, CD40, and CD83 expression in activated dendritic cells. Dot plots on the left side of the figure correspond to DCs stained with C83-FITC and CD86-PE antibodies and dot plots on the right side to DCs stained with C40-FITC and HLA-DR-PECy5 antibodies. E. coli LPS (LPS, 100 ng/ml) was used as the positive control. For each activation marker, the percentage of positive cells and mean fluorescence intensity (MFI) are indicated on each corresponding axis and are representative of the data obtained for one experiment out of 13 performed for H. pylori strain B38 and strain B45. (PE: phycoerythrine, PECy5: phycoerythrine-cyanine 5, FITC: fluorescein isothiocyanate).
