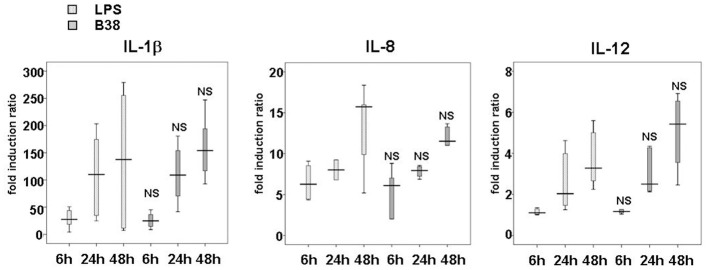
Figure A4.

Kinetics of IL-1β, IL-8 and IL-12 production by E. coli LPS- or H. pylori-activated dendritic cells. DCs were either stimulated with E. coli LPS (100 ng/mL) or cocultivated with H. pylori B38 strain at MOI 1 for 6, 24, or 48 h. IL-1β, IL-8, and IL-12 secretion levels were assessed by ELISA (as described in Material and Methods). The horizontal bar across the box indicates the median and the capped bars indicate the minimum and maximum data values of fold induction ratio vs. DCs alone obtained for 6 independent experiments corresponding to 6 different donors. These results are representative of those obtained for H. pylori B45 strain-activated DC performed in parallel during the same experiments. NS for p > 0.05 compared to E. coli LPS-activated DC at the corresponding time-point.
