
Figure 3.
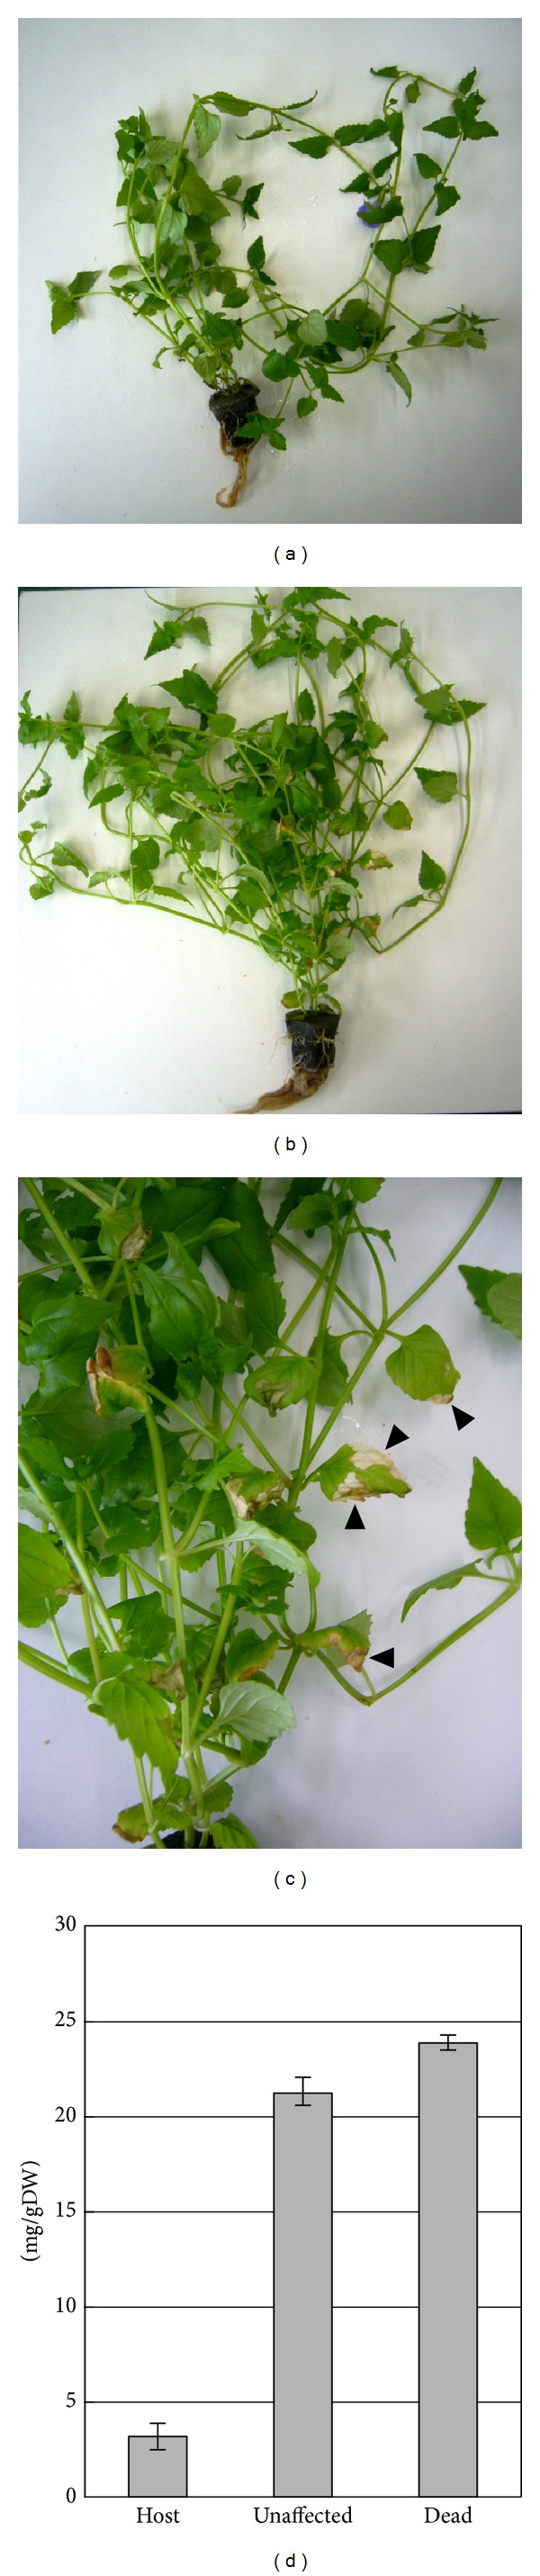
Dead tissue in AtPHR1 transgenic torenia. (a) Host plant at the end of hydroponic experiment. (b) AtPHR1 transgenic plant after 4 weeks of hydroponic experiment. (c) Magnified image of (b). Arrowheads indicate partially dead sections. (d) Phosphorus concentration in unaffected and dead areas from leaves of host and AtPHR1 transgenic plants. The longitudinal axis shows the phosphorus concentration per gram dry weight of sample (mg/gDW).