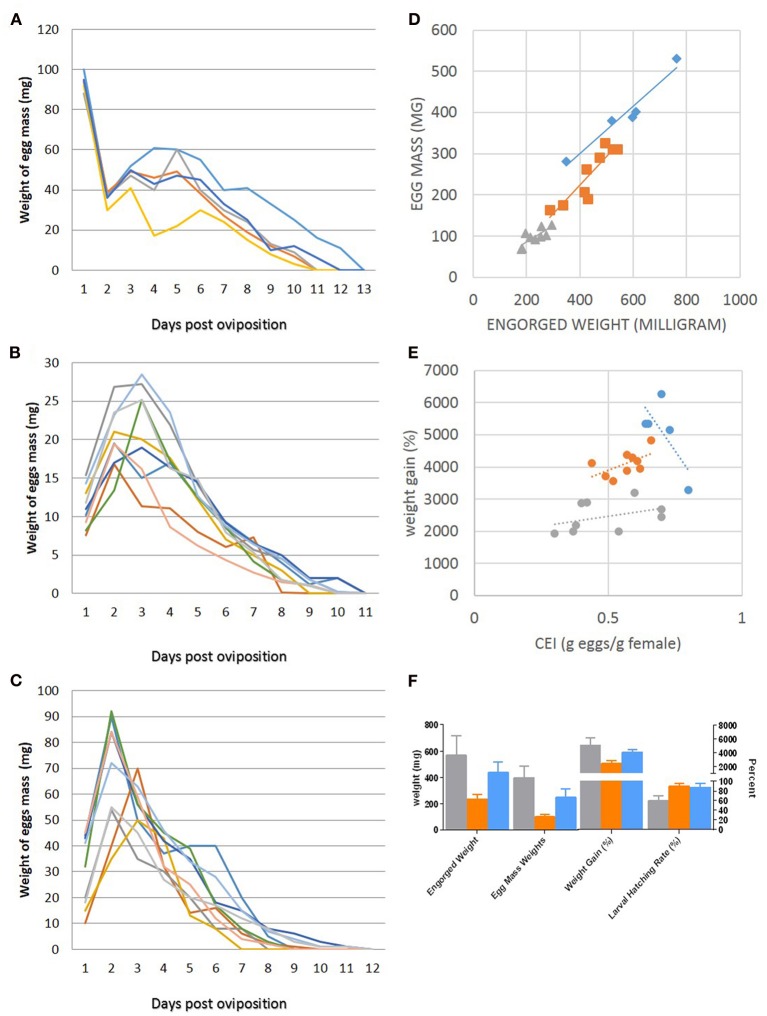
Figure 4.
Summary of oviposition data (A–F). Newly deposited egg mass weights measured daily of the females fed on mice (A), guinea pigs (B), and rabbits (C). Each color represents an individual female. Comparisons of egg mass to engorged weight (D) and weight gain to conversion efficiency index (CEI) in (E). (F) Comparison of the engorged weights, total egg mass weights, and weight gains (%) of the females fed on the three different hosts. For D–F, data are color-coded in gray for mice, orange for guinea pigs, and blue for rabbits.

