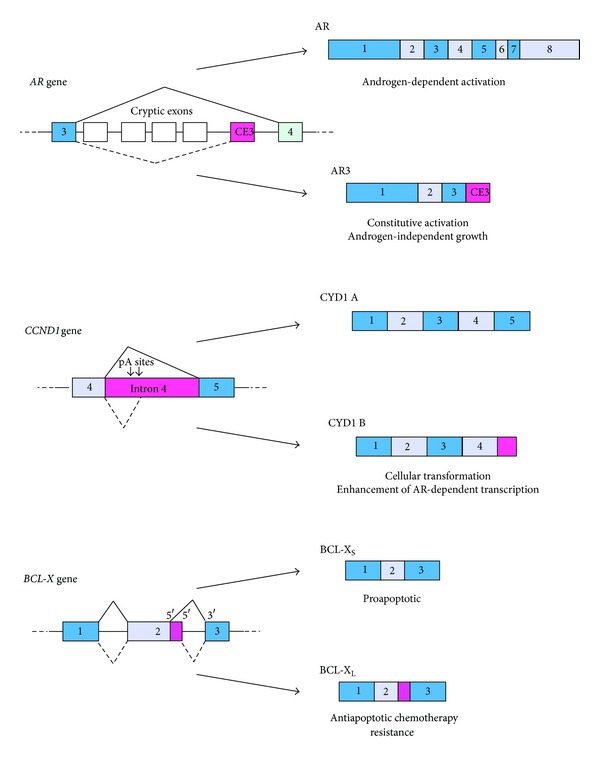
Figure 1.

Representative examples of genes whose alternative splicing affects prostate cancer cell biology. The left side of the figure illustrates the genomic structure of the alternatively spliced regions of the AR, CCND1, and BCL-X genes. Solid and dashed lines show the alternative splicing events reported in the literature. On the right side, the alternative variants produced by splicing are shown. The specific features of the protein isoforms produced by alternative splicing are summarized under the scheme of each variant.
