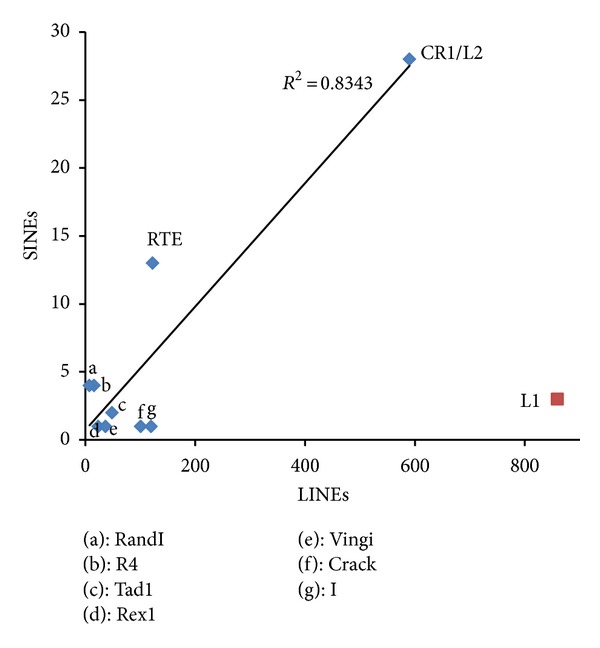
Figure 4.

Relationship between the number of SINE/LINE pairs and the number of LINEs in each clade. The vertical axis shows the number of SINEs with a LINE tail [34]. The horizontal axis shows the number of LINEs belonging to each clade. The linear regression line, determined by the least squares approach, is shown, except for L1. R 2 indicates the coefficient of determination. CR1-clade LINEs (580 families) and L2-clade LINEs (10 families) were summed due to their confusing nomenclature.
