
Figure 1.
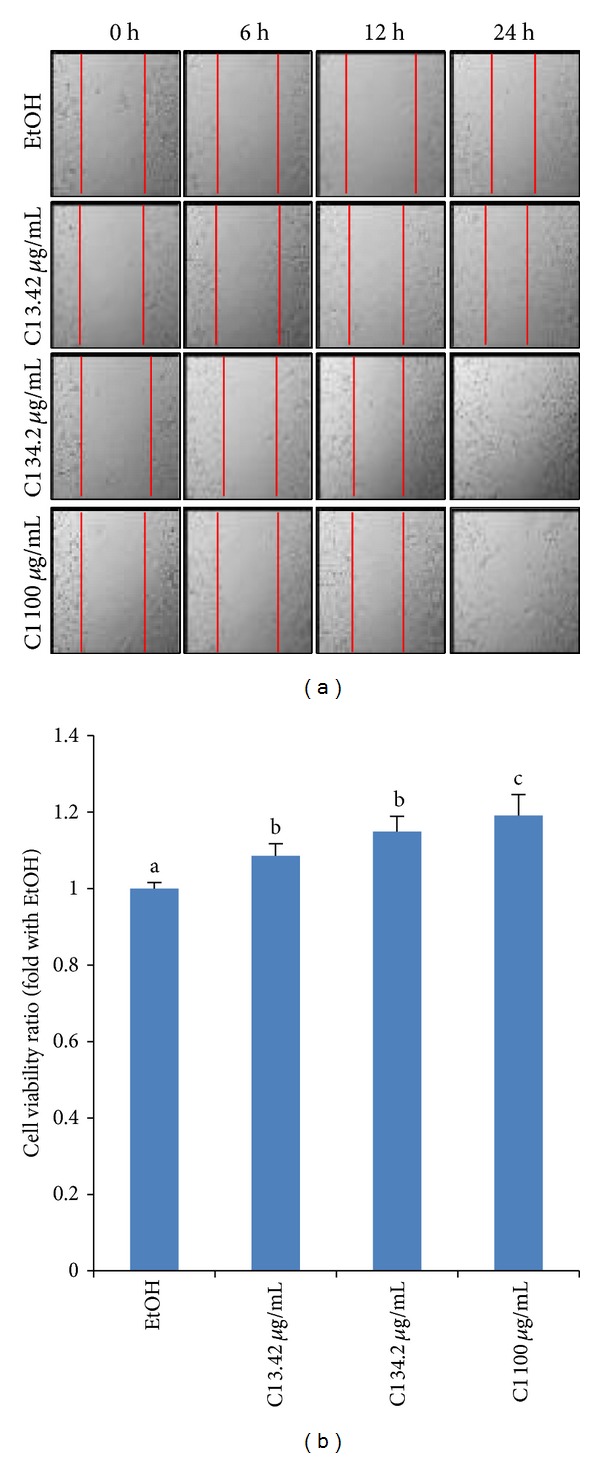
Cell migration and proliferation by SWE. (a) Balb/c 3T3 fibroblasts were scratched using a pipette tip to make gaps between cells before treatment. At 6, 12, and 24 h of treatment, the plates were photographed under a light microscope (40x). This picture is representative of five independent fields. It is notable that 100 μg/mL SWE for 24 h is toxic to the cells. (b) Balb/c 3T3 cell proliferation was measured using the CellTiter96 Aqueous One Solution Cell Proliferation Assay. Values are expressed as mean ± SD of four replicates. Different letters (a, b, and c) represent statistically significant differences of means between groups (P < 0.05).