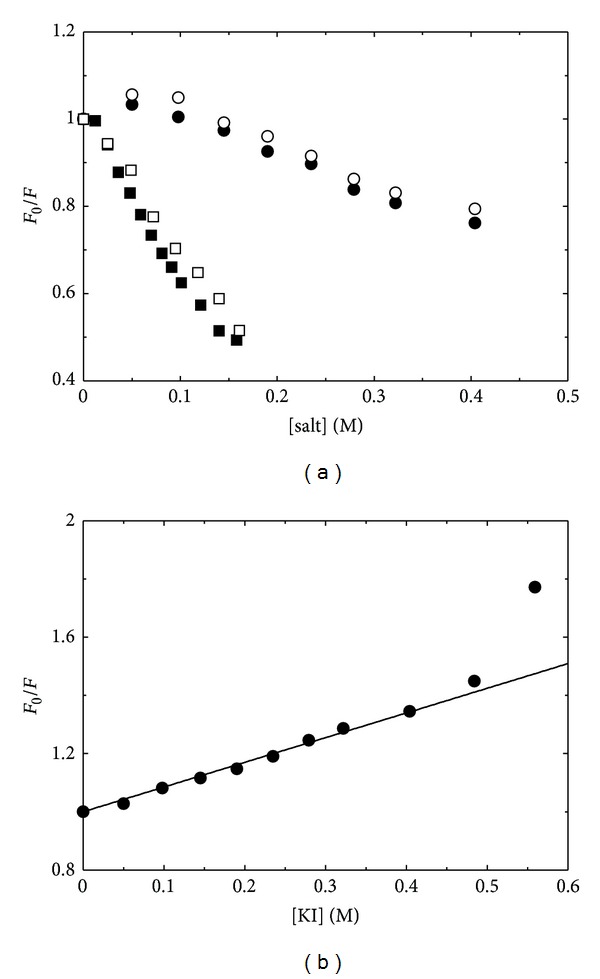
Figure 4.

Dependence of fluorescence emission intensity on quencher concentration. (a) Dependence of the relative emission intensity at 384 nm, upon excitation at 330 nm, of PLP-GSAM (circles) and PMP-GSAM (squares) on caesium chloride (closed symbols) and potassium chloride (open symbols) concentration. (b) Stern-Volmer plot for the quenching of PLP-GSAM by iodide. The line through data points represents the fitting to (1).
