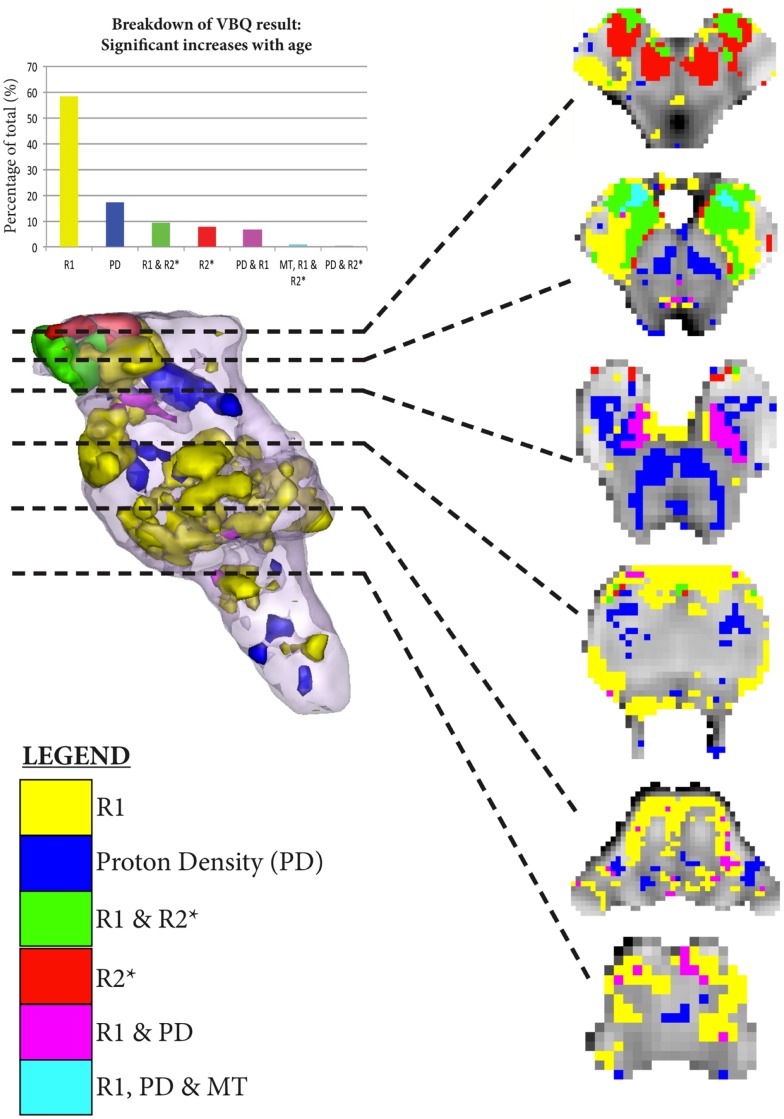
Figure 7.
Significant regional increases binarized at p < 0.001 uncorrected. The legend classifies the regions of significant increase across the MPM, allowing overlapping significant increases to be simultaneously visualized. The histogram takes the total number of all significant voxels shown in the rendering, and then classifies them according to the MPMs in which those voxels are found in as per the legend.

