
Fig. 11.
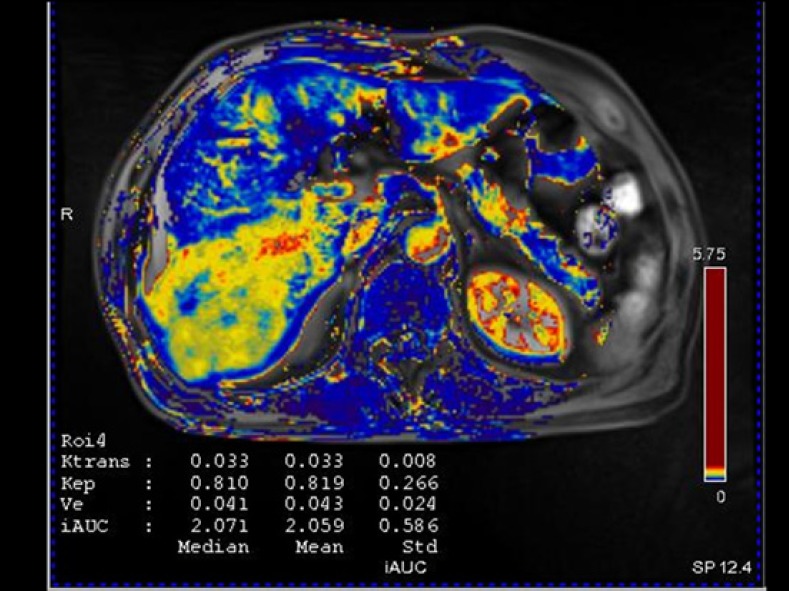
DCE-MRI of the same patient as that in Fig. 9. Although Gd-EOB-DTPA-enhanced MRI showed atypical enhancement of the pathologically confirmed HCC lesion in the right lobe of the liver, the Ktrans map of DCE-MRI shows increased Ktrans values compared with that of adjacent liver parenchyma.