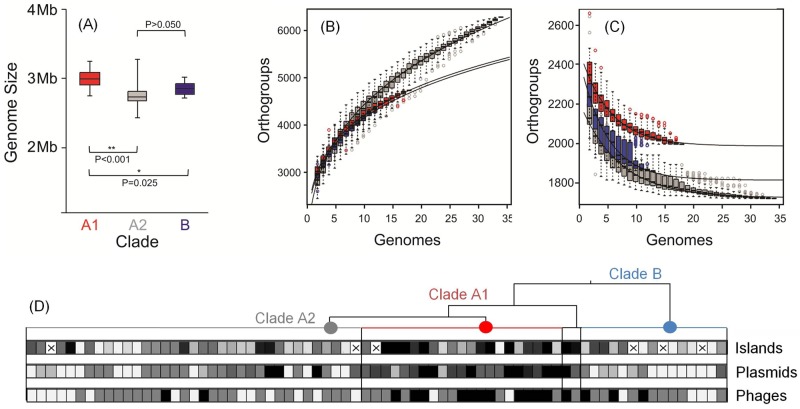
FIG 4 .
(A) Genome size comparison for E. faecium clade A1 (red), A2 (gray), and B (dark blue). (B and C) Pan-genome (B) and core genome (C) are shown for increasing values of the number of sequenced E. faecium genomes within each clade. Circles represent the number of new or core genes present when a particular genome is added to each subset. Black bars represent median values. The curve for the estimation of the size of the E. faecium pan-genome for each clade is a least-squares power law fit through medians. The size of the core genome within each clade was estimated by fitting an exponential curve through medians. (D) Heat map showing the enrichment in genetic mobile elements in E. faecium genomes within each clade (clade A1 [red], A2, [gray], and B [light blue]). Horizontal boxes represent strains, which are ordered within clades as in Fig. 2 (rotated 90°). The aggregate length (kb) of islands was used to compare content in each clade (ranging from 4 kb to 99 kb; median, 17 kb), whereas the numbers of putative plasmids (ranging from 0 to 9; median, 3) or phage elements (ranging from 0 to 4; median, 1) are represented. The heat map reflects the 10th percentile (light gray), 50th percentile (medium gray), and 90th percentile (black). The “×” symbol in a box indicates genome sequence for which the length of genomic islands could not be determined using the SIGI-HMM algorithm (27).

