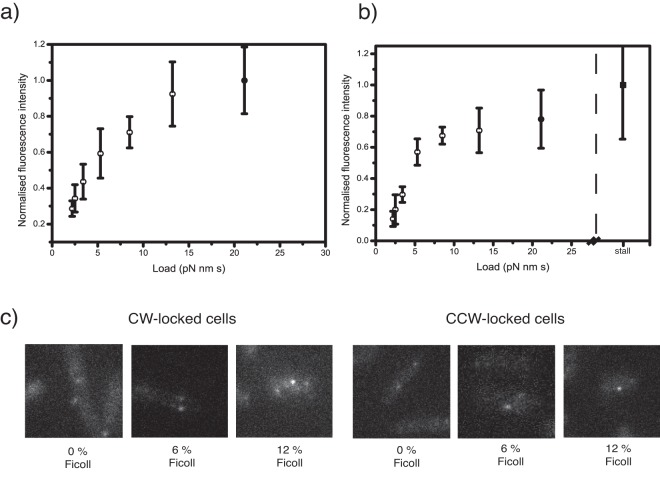
FIG 3 .
Fluorescence spot intensity plotted against external load for (A) CW-locked and (B) CCW-locked motors in E. coli strain JPA806. The load conditions shown are, in left-to-right order: 0.35 µm beads in 0, 1, 3, 6, 9 and 12% Ficoll (light circles) and 1µm beads with no Ficoll (filled circle), and, for the CCW graph, motors stalled by external magnetic fields (filled square). Each data point for rotating beads represents the mean fluorescence intensity of at least 15 motors for each load condition. 5 motors were measured for the stall data point. Error bars show s.d. of fluorescence intensities. Figure 4c shows representative fluorescence images of GFP-MotB spots in CW-locked (left) and CCW-locked (right) motors driving 0.35 µm beads through 0%, 6% and 12% Ficoll solutions.

