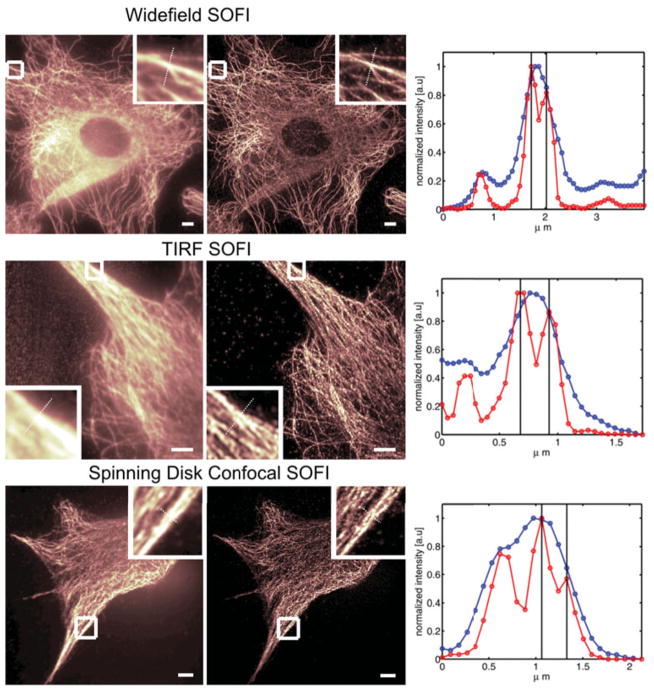
Fig. 2.
SOFI performed on various microscopes. All images are showing the tubulin network of NIH 3T3 fibroblasts immune-stained with infrared emitting quantum dots. The images on the left column correspond to the original images as acquired by the respective microscope (2000 frames). The middle column shows the corresponding second-order SOFI images and the right columns depict line profiles taken along the cross-sections as indicated in the magnified areas of each image (blue line : conventional image, red line : SOFI image). Evidently, the resolution is increased by SOFI in all cases (manifesting features that were not resolved in the original images). Upper panel: Widefield microscope. Scalebar : 5 μm. Distance between black lines in the cross-sections plot is 234 nm. Middle panel : TIRF microscope. Scalebar : 5 μm. A stray light contribution (left side of the original image) is automatically removed by the SOFI algorithm since stray light lacks fluctuations and therefore yields a zero value in the SOFI image. Quantum dots previously hidden in the stray light become clearly visible. Distance between black lines in the cross-sections plot : 245 nm. Lower Panel: Spinning Disk Confocal microscope. Scalebar 5 μm. Distance between black lines in the cross-sections plot is 266 nm.

