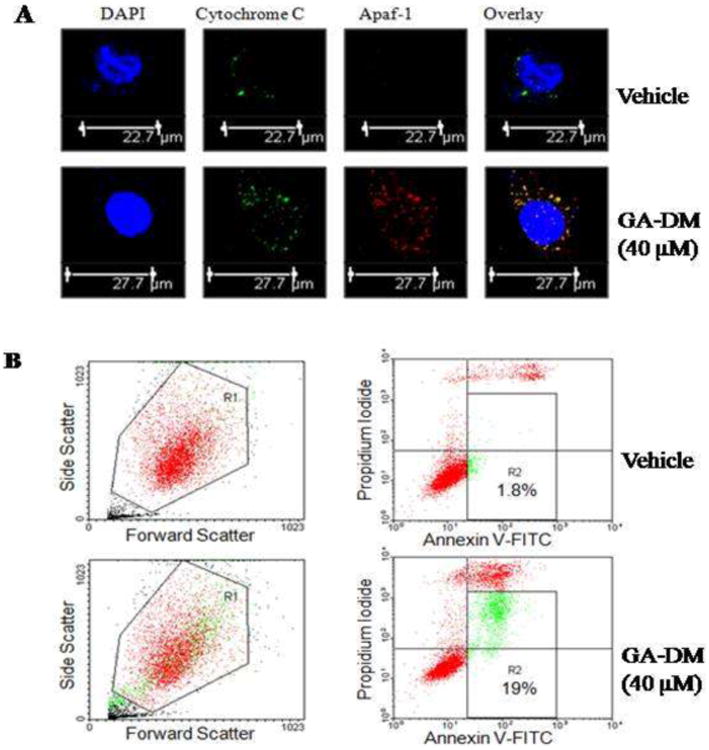
Figure 4.

GA-DM treatment upregulates cytochrome c and Apaf-1 proteins in melanoma cells. (A) Cells treated with vehicle alone or GA-DM (40 μM) were simultaneously stained with primary antibodies against cytochrome c and Apaf-1, followed by fluorophore-conjugated secondary antibodies as described in the Materials and Methods. Representative confocal microscopy images of J3 melanoma cells indicate increased levels of cytochrome c (green) and Apaf-1 proteins (red) and their co-localization (overlay, yellow) following GA-DM treatment. DAPI (blue) was used to stain nuclei of J3 cells. (B) Dot plot depicting forward-(FSC) versus side-scatter (SSC) profile of J3 cells (at least 20,000 events/sample) after incubation with GA-DM (40 μM) or vehicle for 24 h at 37°C. The bulk of J3 cells (in the gate R1) distinguishable from smaller cellular debris (low FSC) and larger cell clumps (high FSC), were analyzed for annexin V and PI double staining (right panels). The quadrants (R2) represent the annexin V-positive apoptotic cells. Data are representatives of at least three independent experiments with similar patterns.
