
Figure 1.
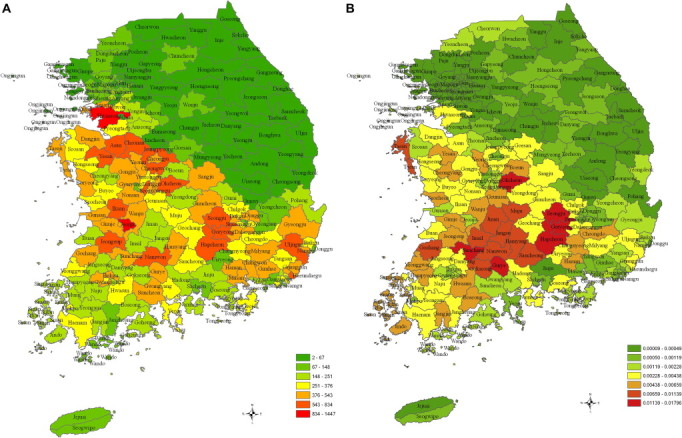
(A) Incidence map by districts; (B) incidence rate map by districts per capita.
Official websites use .gov
A
.gov website belongs to an official
government organization in the United States.
Secure .gov websites use HTTPS
A lock (
) or https:// means you've safely
connected to the .gov website. Share sensitive
information only on official, secure websites.
(A) Incidence map by districts; (B) incidence rate map by districts per capita.