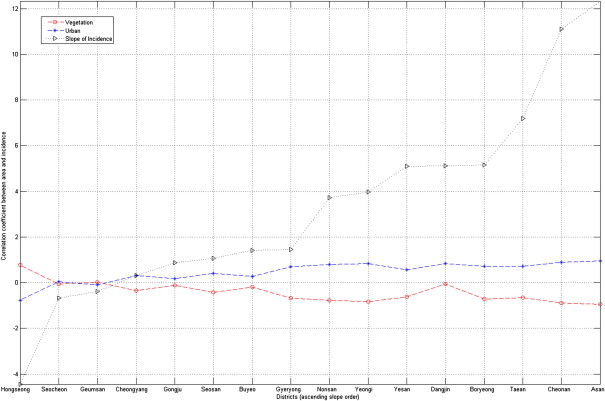
Figure 10.

Correlation coefficients between urban land category and incidence number (blue line) and between vegetation land category and incidence number (red line). The slope of first order polynomial fitting to the yearly varying incidence number (black line).
