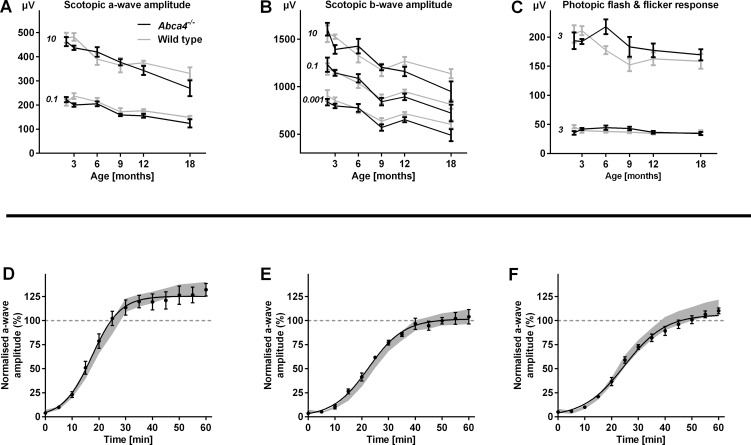
Figure 4. .
Functional testing by means of electroretinography in Abca4−/− and WT control mice. (A–C) Mean scotopic and photopic amplitudes ± SEM across all tested ages for representative flash intensities (for full range of mean traces see Supplementary Fig. S4). Numbers in italics indicate flash intensity in cd/m2. The only significant difference between Abca4−/− mice and WT controls was observed in the scotopic testing of 18-month-old animals. n equals 5 to 8 in each group, except n equals 4 for 18-month-old WTs. (D–F) Kinetics of dark adaptation in Abca4−/− compared with WT control mice (n = 5–7 in each group) aged 1 (D), 4 (E), and 8 (F) months. The mean (±SEM) scotopic a-wave amplitude relative to baseline before a photobleach is shown. The grey area represents the mean ± 2SDs of the dark adaptation kinetics in WT mice. Recovery after photobleach was faster in 1-month-old compared with 4- and 8-month-old animals. Dark adaptation kinetics were similar in Abca4−/− and WT control mice.

