Figure 2. .
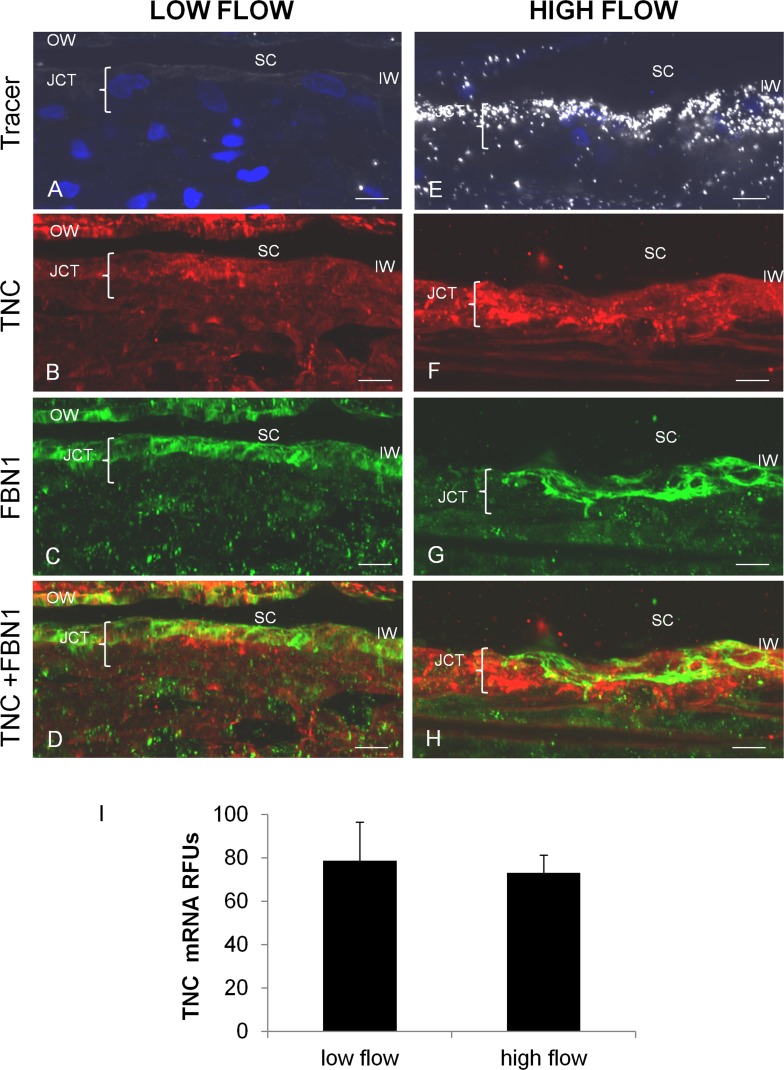
TNC immunostaining and mRNA levels in high and low outflow regions. Human anterior segments were labeled with 594-nm-labeled fluospheres ([A, E], white). The distribution of TNC ([B, F], red) and fibrillin-1 ([C, G], green) immunostaining and their colocalization (D, H) were assessed. OW, outer wall; IW, inner wall; SC, Schlemm's canal; JCT, juxtacanalicular region. Scale bars: 10 μm. (I) TNC mRNA levels (relative fluorescent units) in high and low outflow regions by quantitative RT-PCR normalized for GAPDH mRNA levels. Low flow, n = 4; high flow, n = 6. No significant difference was found.

