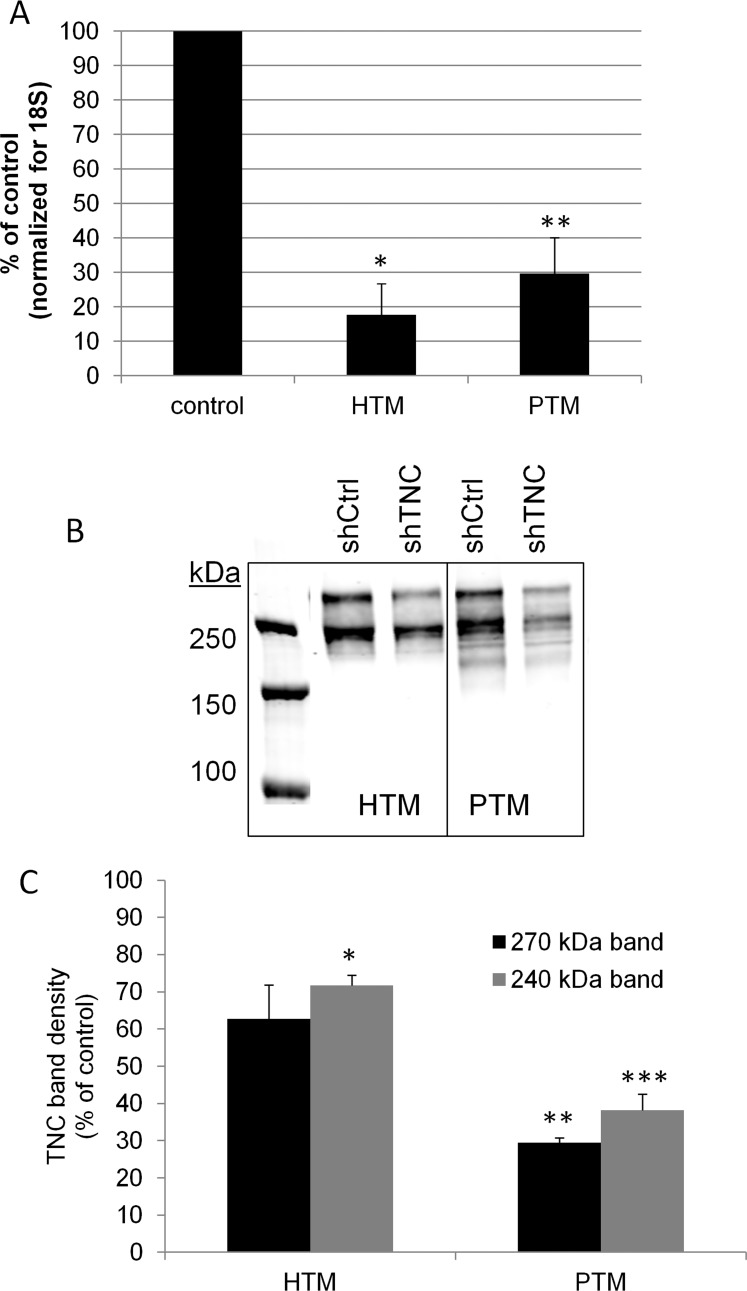
Figure 3. .
Generation of silencing lentivirus targeting TNC. (A) Quantitative RT-PCR to measure TNC mRNA levels in shTNC-infected human TM (HTM) and porcine TM (PTM) cells. *P = 0.0001 and **P = 0.001 by ANOVA; n = 4. (B) Western immunoblot showing knockdown of TNC in the media from control (shCtrl) and shTNC-infected HTM and PTM cells. Two bands at approximately 270 kDa and 240 kDa were detected. (C) Densitometry quantitation of the two bands showed a significant decrease in protein levels in shTNC-infected TM cells compared to control cells. *P = 0.009; **P = 0.0001; ***P = 0.005 by ANOVA; n = 2.

