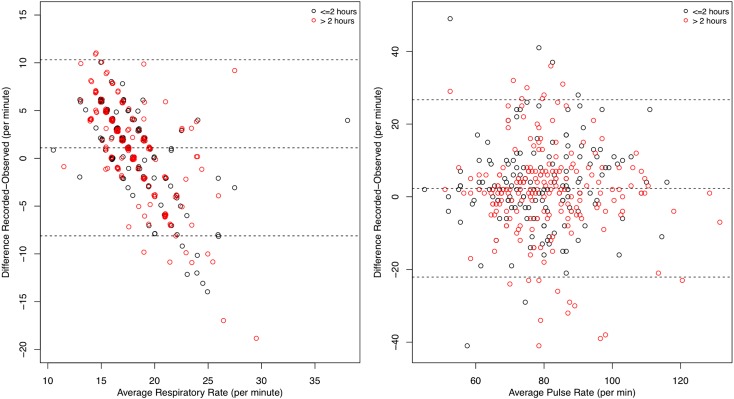
Figure 2.
Bland-Altman plot of respiratory and pulse rates. Differences between directly observed and recorded values vs the mean of those measurements are shown. Each dot indicates a specific patient. Black dots indicate ≤ 2 h between measurement of directly observed and recorded values. Red dots indicate > 2 h between measurements.

