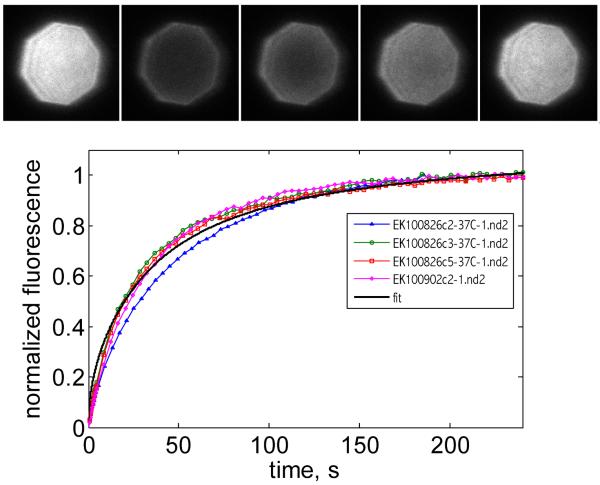
Figure 2.
Verifying the fluidity of an SBL. Inset shows a sequence of images acquired before (1st frame) and after bleaching a region delimited by the field diaphragm (closed to its minimum, ~34 μm across). The bleached region is automatically detected from the pre-bleach picture and its normalized fluorescence as a function of time after bleaching is plotted. Three other measurements (two from different channels on the same coverslip and one from a different coverslip) are also shown to illustrate the level of reproducibility. A representative fit to a function of the form f = a{exp(−2τ /t)·[Io(2τ /t)+I1(2τ /t)]}, where Io and I1 are modified Bessel functions and τ = w2 /(4D) is the characteristic diffusion time over a circle of radius w53, is shown. The best fit parameters are a=1.13 and τ = 30s (R2=0.99), implying a diffusion coefficient D = 2.4 μm2/s.

