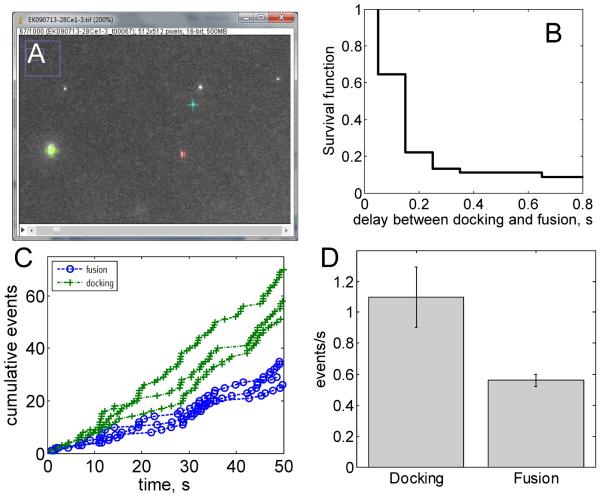
Figure 8.
Analysis of TIRFM data (17ms time resolution) using SpeckleTrackerJ and the MatLab program EK_Analyze_EKtraj_F_batch.m provided as supplementary material. (A) Screenshot of SpeckleTrackerJ. (B) The survival probability after docking, in an experiment where the lipid composition (in mole %) was PC/PS/PE/chol/LR-PE/mPEG2000PE=22.5/11.6/15.4/46/0.6/3.9 for the v-SUVs and PC/PS/PE/chol/PI(4,5)P2/NBD-PE/mPEG2000PE=18.9/11.6/15.4/46/3.9/0.4/3.9 for the t-SBL.

