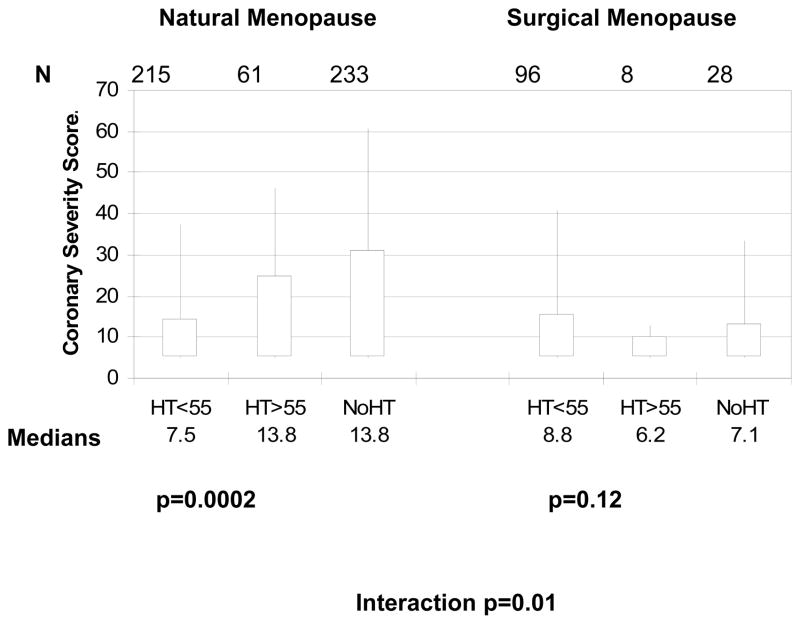
FIG. 1. Surgical versus natural menopause, HT, and angiographic CAD severity.
CAD severity score box plots according to HT use in surgical versus natural menopause and age of HT use onset. The upper and lower edges of the boxes represent the interquartile range, and the whiskers represent the 95th percentile. P values are age adjusted. CAD, coronary artery disease; HT, hormone therapy.

