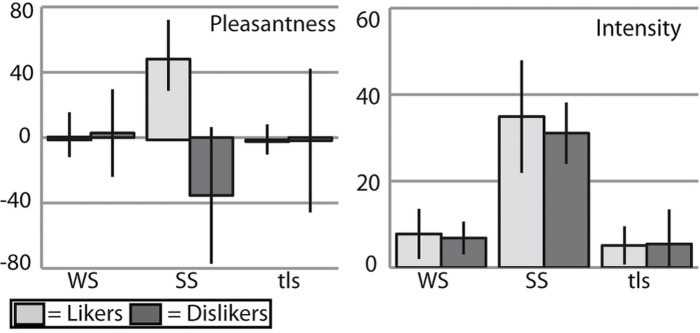
Figure 1.
Pleasantness and intensity ratings. Graphs showing stimuli ratings by group. X-axis: stimulus (WS = weak sweet, SS = strong sweet, tls = tasteless). Y axis: group average rating. Pleasantness ratings were made on a VAS scale; intensity ratings were made on the gLMS (see Materials and methods). As expected, all subjects found WS and tls to be weak and SS to be strong in intensity. All subjects found WS and tls to be approximately neutral in pleasantness. Likers found SS strongly pleasant, whereas dislikers found SS strongly unpleasant.

