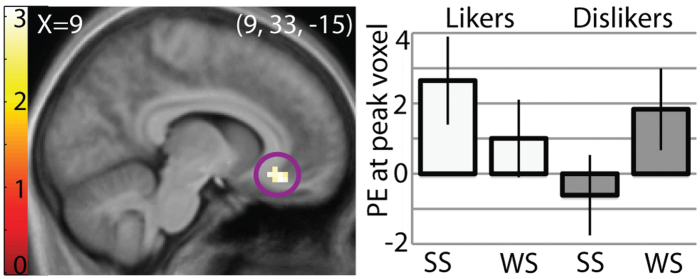
Figure 3.
Regions coding affective value of a sweet taste. Sagittal section showing the vmPFC responding to strong sweet (SS) versus weak sweet (WS) in likers versus dislikers, suggesting that this area is responsive to the affective value of a sweet taste. Results are from ANOVA contrast of (SS − WS) in likers – (SS − WS) in dislikers. T-map is thresholded at P < 0.005 and k > 3 voxels. Bar graph shows parameter estimates (PE) of the activity in peak voxel within the circled brain region in response to each stimulus in each group, averaged over subjects. Activation in the vmPFC is significant at P = 0.048 after FDR correction across the voxels of the ROI.

