
Fig. 7.
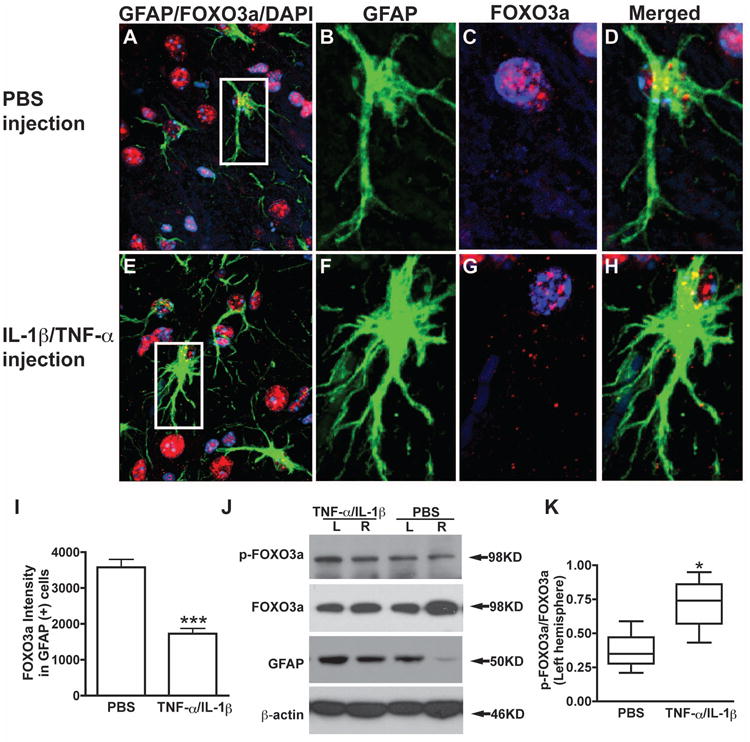
Reduced expression of Foxo3a in astrocytes during astrogliosis in vivo. After 7 days of injection, brain sections were taken for immunohistochemistry and brain tissue lysis were prepared for Western blotting. Representative fluorescence overlay micrographs from confocal pictures show the astrogliosis and Foxo3a expression (GFAP in green, Foxo3a in red) in PBS injection (A, B, C, and D) and TNF-α/IL-1β injection (E, F, G, and H). Nuclei were stained with DAPI (blue). I, Confocal pictures were imported and analyzed with ImageJ-ProPlus. Foxo3a expression was quantified by fluorescence intensity in 200 GFAP-positive cells random chose from 20 brain sections of four mice each group. J, Protein extracts from brain tissue contained injection site were subjected to Western blotting for p-Foxo3a, Foxo3a, and GFAP. β-actin was used as a loading control. K, The ratio of p-Foxo3a to total Foxo3a from left cerebral hemisphere (LH) was showed. Boxes encompass the interquartile ranges; error bars indicate the ranges of value. Horizontal lines, median value for each group (n=4). ***, p < 0.001 in comparison to PBS injection. *, p < 0.05 in comparison to PBS injection.