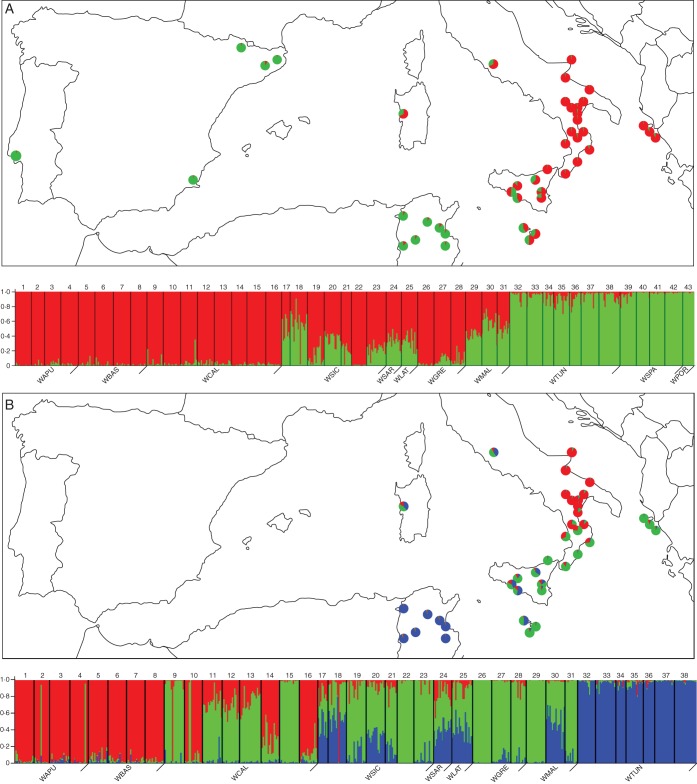
Fig. 2.
Map of geographical distribution showing the average proportion of the Q value inferred by STRUCTURE and its relative plot for (A) wild cardoon at K = 2, and (B) wild cardoon without WSPA and WPOR populations at K = 3. For K = 2 group 1 (red) includes populations from Italy and Greece; Tunisian, Spanish and Portuguese populations are included in group 2 (green). For K = 3, group 1 (blue), group 2 (green) and group 3 (red) can be distinguished. Populations are separated by black vertical lines and indicated with a progressive number (see Supplementary Data Table S1 for population details). Colours indicate individual estimated membership fraction.

