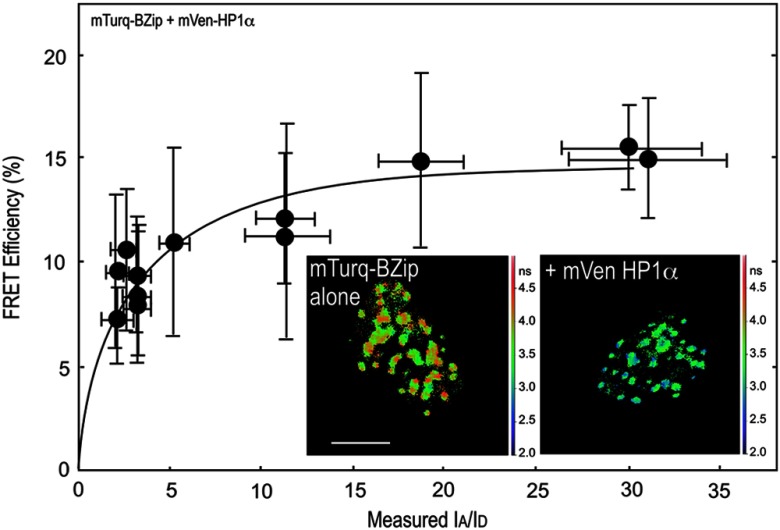
Fig. 3.
FRET-FLIM analysis of the interactions between the BZip domain and HP1α. The FD FLIM FRET approach was used to determine FRET efficiency (%) as described in the legend for Fig. 2. Each point represents the . The image insets show the fluorescence lifetime maps acquired of the nuclei of representative cells expressing the mTurquoise-BZip domain alone, or when co-expressed with Venus-HP1α; the scale bar indicates 10 μm.

