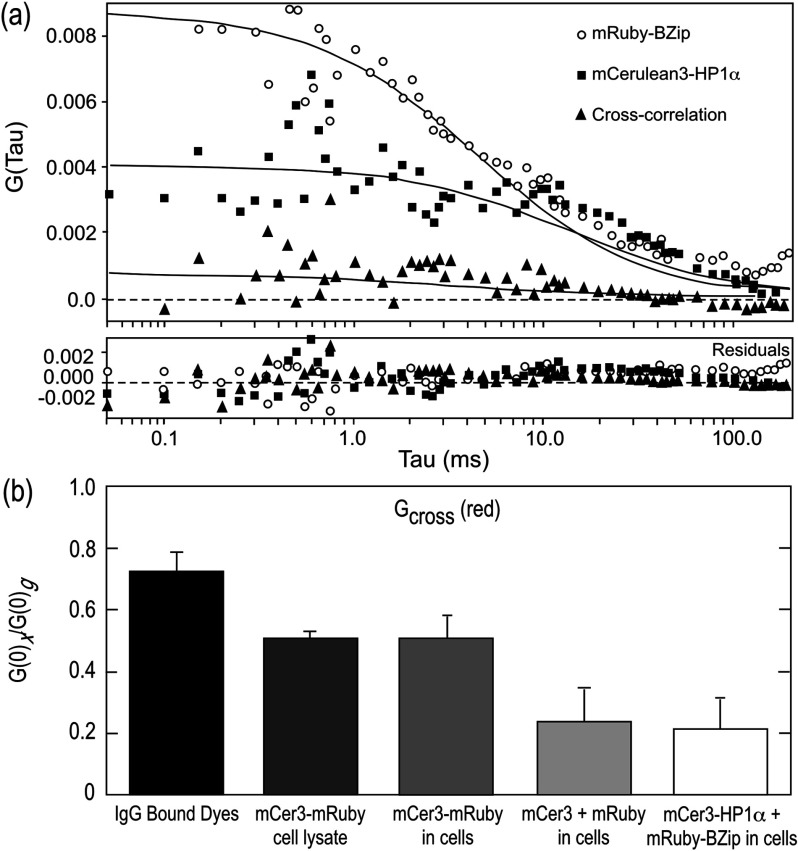
Fig. 5.
FCCS measurements of red and green fluorophores. (a) Representative cross-correlation measurement of mRuby-BZip co-expressed with mCerulean3-HP1α. (b) Mean and standard deviation of cross-correlation amplitudes found for different pairs of red and green fluorophores. The positive control for cross-correlation was the antibody-linked dyes (IgG Bound Dyes). All measurements from cells used the same red (mRuby) and green (mCerulean3) FP pair. The control for cross-correlation for the FPs was the linked fusion protein mCer3-mRuby, and this was measured in both cell lysates and in living cells. The co-expression of the individual FPs (mCer3 + mRuby) provided a negative control for cross-correlation, and this is compared to cells co-expressing the mCerulean3-HP1α and mRuby-BZip fusion proteins.

