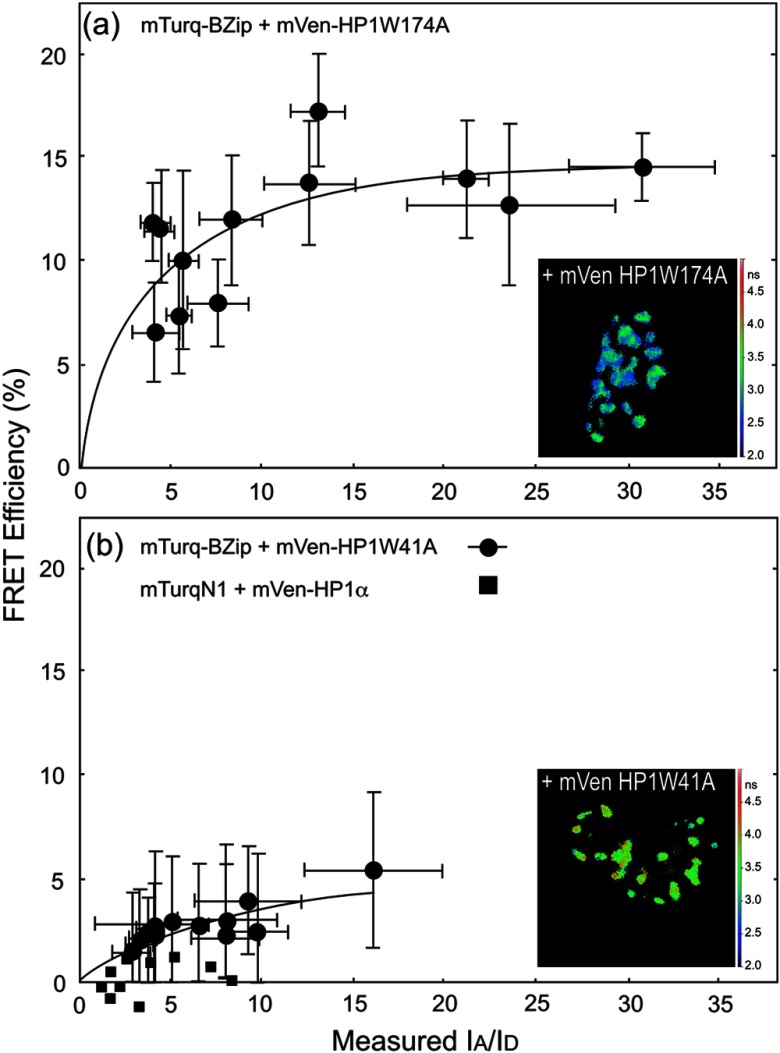
Fig. 7.
FRET-FLIM analysis of the interactions between the BZip domain and the W174A and W41A point mutants of HP1α. The FD FLIM approach was used to measure the average donor lifetime in multiple ROI for each cell, and this was used to determine the FRET efficiency for the indicated donor- and acceptor-labeled proteins. The FRET efficiency (%) is plotted as a function of average measured in the same ROI. Each point represents the . The inset panels show the lifetime maps of the nuclei for representative cells co-expressing mTurquoise-BZip and the indicated mVenus-HP1mutant; the scale bar indicates 10 μm.

